* updates for kf 0.4.1 * update aks regions and nvidia device plugin * updates * update jupyterhub |
||
|---|---|---|
| .. | ||
| solution-chart | ||
| src | ||
| README.md | ||
| tensorboard.png | ||
README.md
Automated Hyperparameters Sweep with TFJob and Helm
Prerequisites
"Vanilla" Hyperparameter Sweep
Just as distributed training, automated hyperparameter sweep is barely used in many organizations. The reasons are similar: It takes a lot of resources, or time, to run more than a couple training for the same model.
- Either you run different hypothesis in parallel, which will likely requires a lot of resources and VMs. These VMs need to be managed by someone, the model need to be deployed, logs and checkpoints have to be gathered etc.
- Or you run everything sequentially on a few number of VMs, which takes a lot of time before being able to compare result
So in practice most people manually fine-tune their hyperparameters through a few runs and pick a winner.
Kubernetes + Helm
Kubernetes coupled with Helm can make this easier as we will see. Because Kubernetes on Azure also allows you to scale very easily (manually or automatically), this allows you to explore a very large hyperparameter space, while maximizing the usage of your cluster (and thus optimizing cost).
In practice, this process is still rudimentary today as the technologies involved are all pretty young. Most likely tools better suited for doing hyperparameter sweeping in distributed systems will soon be available, but in the meantime Kubernetes and Helm already allow us to deploy a large number of trainings fairly easily.
Why Helm?
As we saw in module 3 - Helm, Helm enables us to package an application in a chart and parametrize it's deployment easily.
To do that, Helm allows us to use Golang templating engine in the chart definitions. This means we can use conditions, loops, variables and much more.
This will allow us to create complex deployment flow.
In the case of hyperparameters sweeping, we will want a chart able to deploy a number of TFJobs each trying different values for some hyperparameters.
We will also want to deploy a single TensorBoard instance monitoring all these TFJobs, that way we can quickly compare all our hypothesis, and even early-stop jobs that clearly don't perform well if we want to reduce cost as much as possible.
For now, this chart will simply do a grid search, and while it is less efficient than random search it will be a good place to start.
Exercise
Creating and Deploying the Chart
In this exercise, you will create a new Helm chart that will deploy a number of TFJobs as well as a TensorBoard instance.
Here is what our values.yaml file could look like for example (you are free to go a different route):
image: ritazh/tf-paint:gpu
useGPU: true
hyperParamValues:
  learningRate:
    - 0.001
    - 0.01
    - 0.1
  hiddenLayers:
    - 5
    - 6
    - 7
That way, when installing the chart, 9 TFJob will actually get deployed, testing all the combination of learning rate and hidden layers depth that we specified.
This is a very simple example (our model is also very simple), but hopefully you start to see the possibilities than Helm offers.
In this exercise, we are going to use a new model based on Andrej Karpathy's Image painting demo.
This model objective is to to create a new picture as close as possible to the original one, "The Starry Night" by Vincent van Gogh:
The source code is located in src/.
Our model takes 3 parameters:
| argument | description | default value |
|---|---|---|
--learning-rate |
Learning rate value | 0.001 |
--hidden-layers |
Number of hidden layers in our network. | 4 |
--log-dir |
Path to save TensorFlow's summaries | None |
For simplicity, docker images have already been created so you don't have to build and push yourself:
ritazh/tf-paint:cpufor CPU only.ritazh/tf-paint:gpufor GPU.
The goal of this exercise is to create an Helm chart that will allow us to test as many variations and combinations of the two hyperparameters --learning-rateand --hidden-layers as we want by just adding them in our values.yaml file.
This chart should also deploy a single TensorBoard instance (and it's associated service with a public IP), so we can quickly monitor and compare our different hypothesis.
If you are pretty new to Kubernetes and Helm and don't feel like building your own helm chart just yet, you can skip to the solution where details and explanations are provided.
Validation
Once you have created and deployed your chart, looking at the pods that were created, you should see a bunch of them, as well as a single TensorBoard instance monitoring all of them:
kubectl get pods
NAME                                      READY     STATUS    RESTARTS   AGE
module8-tensorboard-7ccb598cdd-6vg7h       1/1       Running   0          16s
module8-tf-paint-0-0-master-juc5-0-hw5cm   0/1       Pending   0          4s
module8-tf-paint-0-1-master-pu49-0-jp06r   1/1       Running   0          14s
module8-tf-paint-0-2-master-awhs-0-gfra0   0/1       Pending   0          6s
module8-tf-paint-1-0-master-5tfm-0-dhhhv   1/1       Running   0          16s
module8-tf-paint-1-1-master-be91-0-zw4gk   1/1       Running   0          16s
module8-tf-paint-1-2-master-r2nd-0-zhws1   0/1       Pending   0          7s
module8-tf-paint-2-0-master-7w37-0-ff0w9   0/1       Pending   0          13s
module8-tf-paint-2-1-master-260j-0-l4o7r   0/1       Pending   0          10s
module8-tf-paint-2-2-master-jtjb-0-5l84q   0/1       Pending   0          9s
Note: Some pods are pending due to the GPU resource available in the cluster. If you have 3 GPUs in the cluster, then there can only be a maximum number of 3 parallel trainings at a given time.
Once the TensorBoard service for this module is created, you can use the External-IP of that service to connect to the TensorBoard.
kubectl get service

NAME                                 TYPE           CLUSTER-IP     EXTERNAL-IP      PORT(S)             AGE
module8-tensorboard                  LoadBalancer   10.0.142.217   <PUBLIC IP>     80:30896/TCP        5m
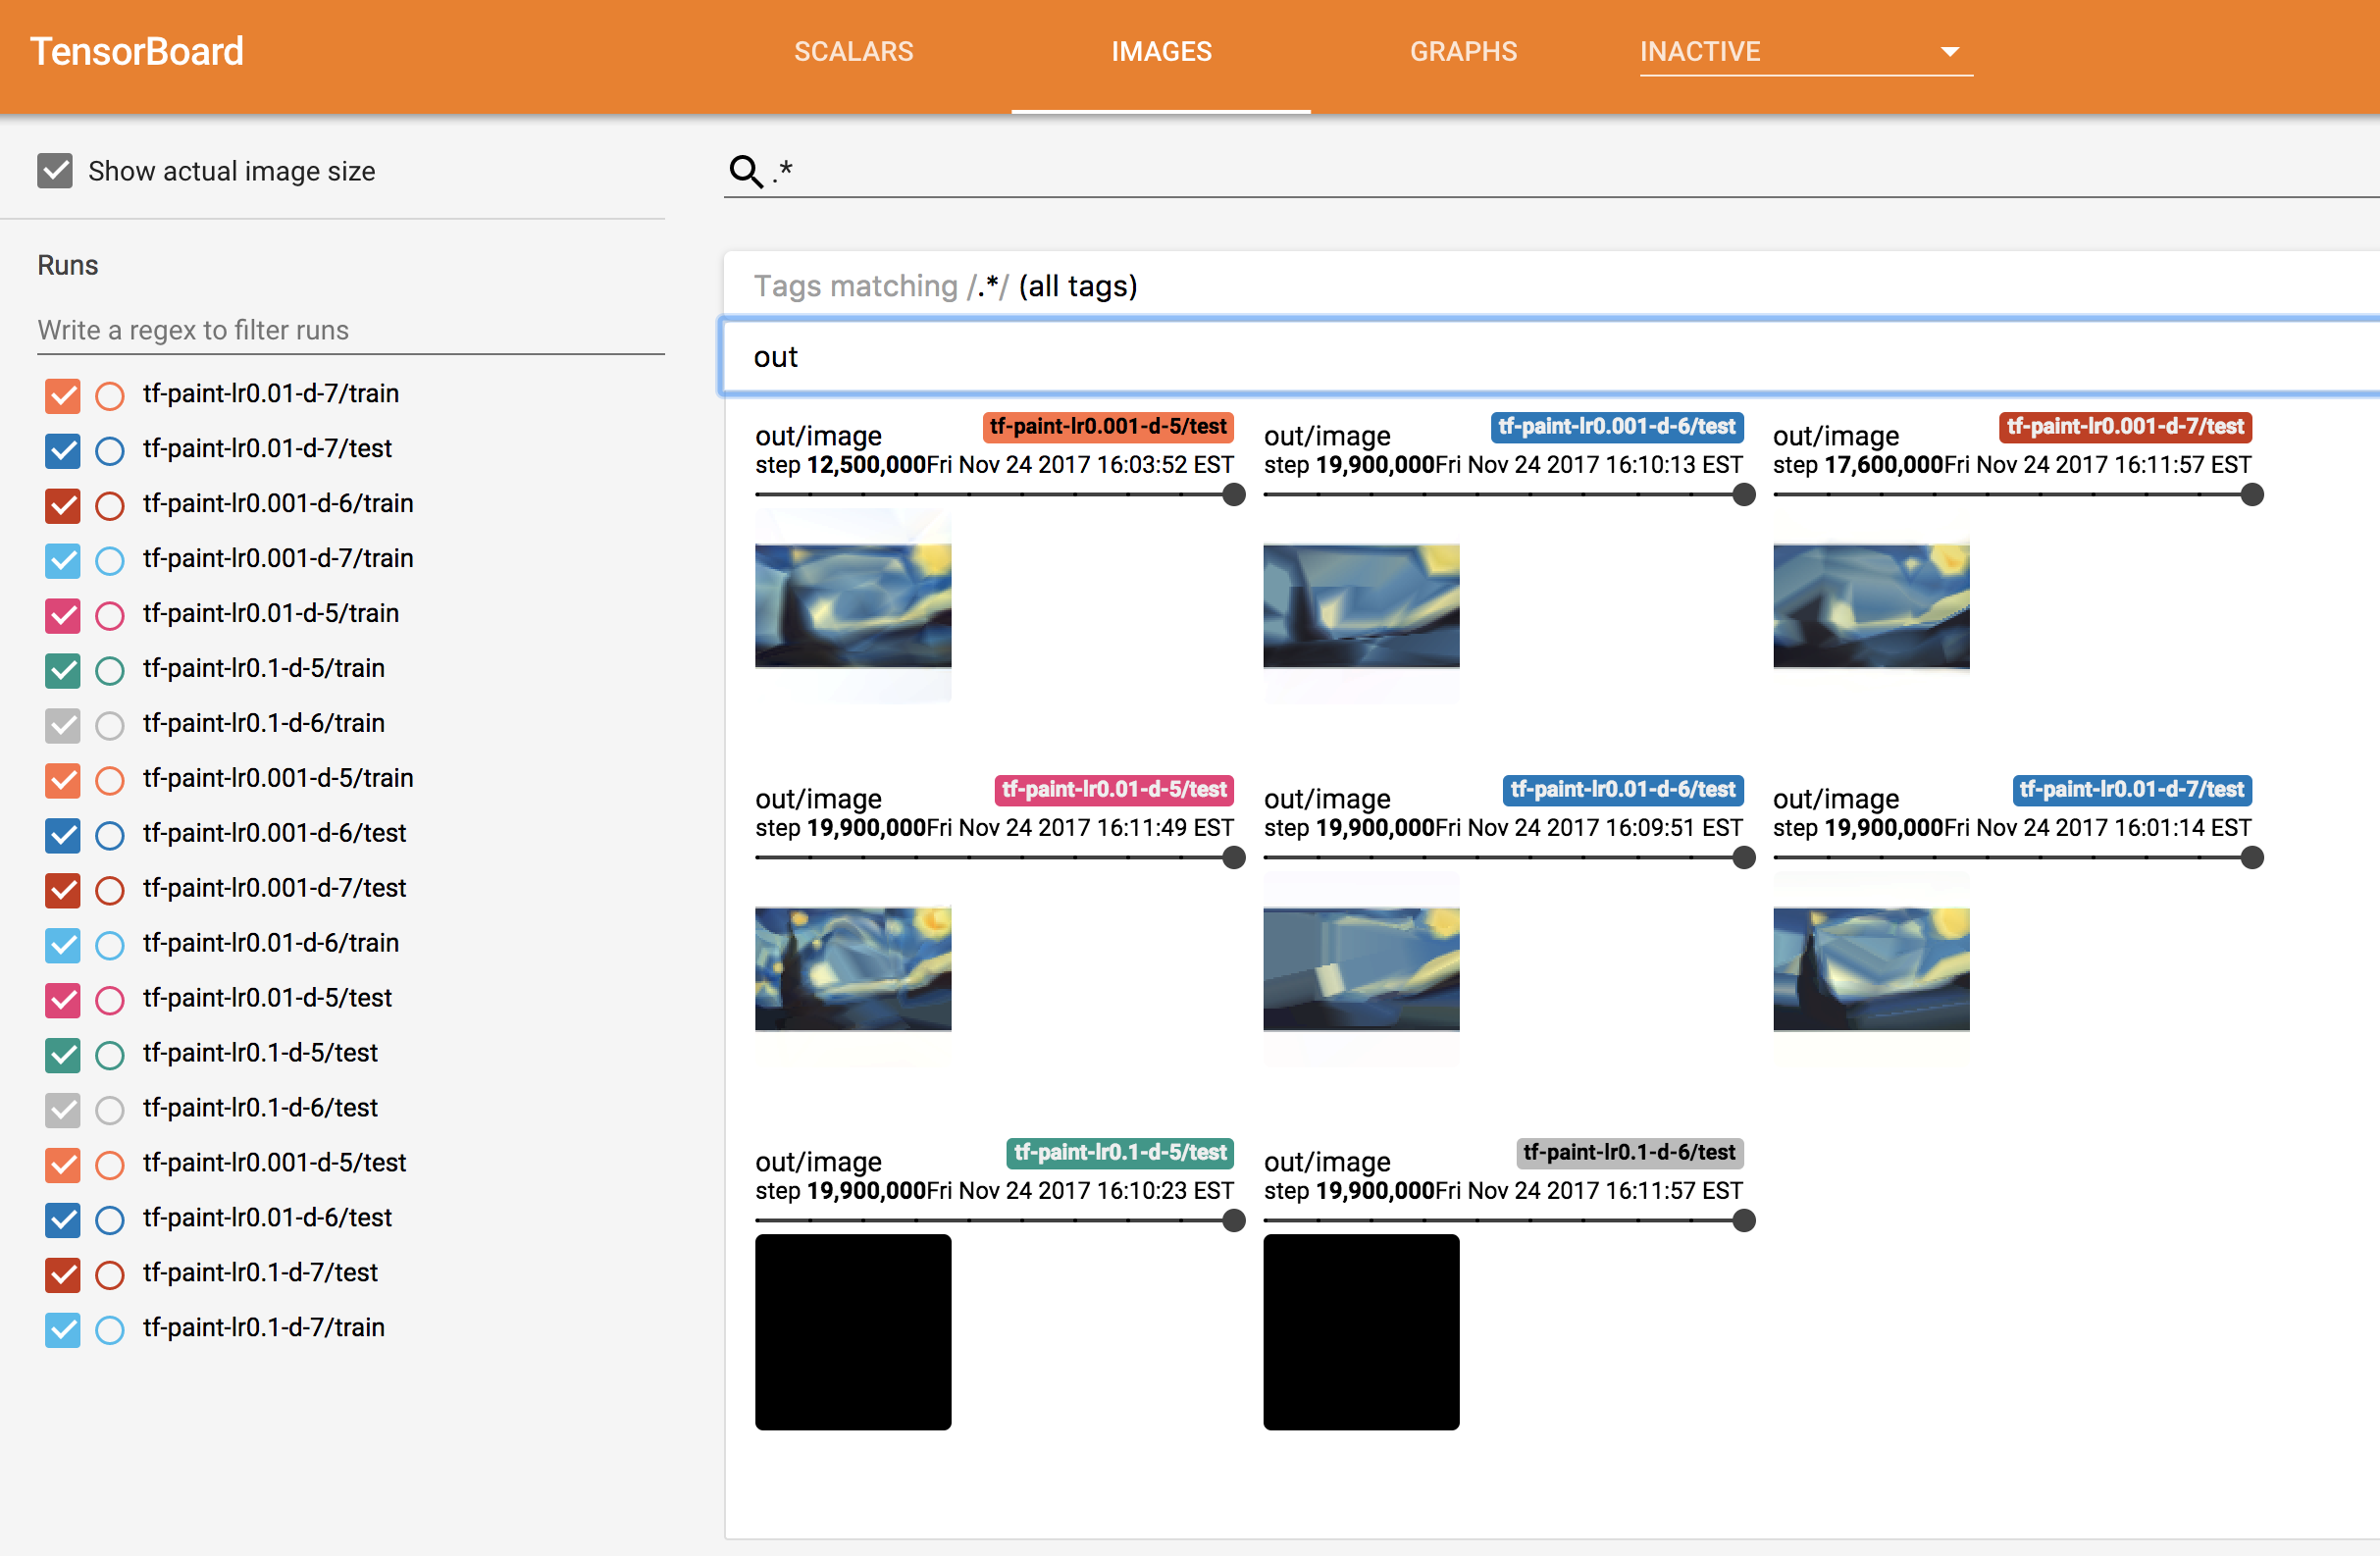
Looking at TensorBoard, you should see something similar to this:

Note that TensorBoard can take a while before correctly displaying images.
Here we can see that some models are doing much better than others. Models with a learning rate of 0.1 for example are producing an all-black image, we are probably over-shooting.
After a few minutes, we can see that the two best performing models are:
- 5 hidden layers and learning rate of
0.01 - 7 hidden layers and learning rate of
0.001
At this point we could decide to kill all the other models if we wanted to free some capacity in our cluster, or launch additional new experiments based on our initial findings.
Solution
Check out the commented solution chart: ./solution-chart/templates/deployment.yaml
Hyperparameter Sweep Helm Chart
Install the chart with command:
cd 8-hyperparam-sweep/solution-chart/
helm install .

NAME:   telling-buffalo
LAST DEPLOYED:
NAMESPACE: tfworkflow
STATUS: DEPLOYED

RESOURCES:
==> v1/Service
NAME                 TYPE          CLUSTER-IP    EXTERNAL-IP  PORT(S)       AGE
module8-tensorboard  LoadBalancer  10.0.142.217  <pending>    80:30896/TCP  1s

==> v1beta1/Deployment
NAME                 DESIRED  CURRENT  UP-TO-DATE  AVAILABLE  AGE
module8-tensorboard  1        1        1           0          1s

==> v1alpha1/TFJob
NAME                  AGE
module8-tf-paint-0-0  1s
module8-tf-paint-1-0  1s
module8-tf-paint-1-1  1s
module8-tf-paint-2-1  1s
module8-tf-paint-2-2  1s
module8-tf-paint-0-1  1s
module8-tf-paint-0-2  1s
module8-tf-paint-1-2  1s
module8-tf-paint-2-0  0s

==> v1/Pod(related)
NAME                                  READY  STATUS             RESTARTS  AGE
module8-tensorboard-7ccb598cdd-6vg7h   0/1    ContainerCreating  0         1s
