Protocol
Interaction protocol consists of JSON commands that are sent to the page and events that the page is generating. We define this protocol in Blink ("upstream") so that any Blink-based browser supported it.
- As of Google Chrome M31, we commit to supporting the version 1.1 of the protocol. All subsequent 1.* versions of the protocol are going to be backwards compatible with 1.1.
- As of Google Chrome M18, we commit to supporting the version 1.0 of the protocol. All subsequent 1.* versions of the protocol are going to be backwards compatible with 1.0.
- As of Google Chrome M16, we commit to supporting the version 0.1 of the protocol. All subsequent 0.* versions of the protocol are going to be backwards compatible with 0.1.
Protocol backwards compatibility is defined as follows:
- No commands or events are removed from the protocol
- No required parameters are added to the commands
- No required parameters are removed from command responses or events
There also is a tip-of-tree version of the protocol that reflects present state of the protocol in Blink repository. You can use it with Google Canary builds at your own risk. Note that unless tip of the tree revision is promoted to the draft, there is no backwards compatibility support guaranteed for the capabilities it introduces.
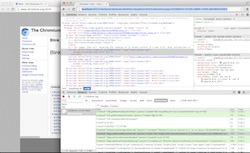
DevTools may introduce new features that are not currently documented under the tip-of-tree protocol documentation. You can discover these if you want to try using features, however, the undocumented protocol is volatile and may break at any time. First, inspect the inspector and reload the inspector so your attached one can view its WebSocket connection (Network > Filter > WebSockets). Then view the frames of WebSocket activity as you use the host DevTools. You may need to re-click the WebSocket item to have the Frame activity update.

Debugging over the wire
Today Developer Tools front-end can attach to a remotely running Chrome instance for debugging. For this scenario to work, you should start your host Chrome instance with the remote-debugging-port command line switch:
Then you can start a client Chrome instance, using a separate user profile:
And now you can navigate to the given port from your client and attach to any of the discovered tabs for debugging.
You will find Developer Tools interface identical to the embedded one and here is why:
- When you navigate your client browser to the remote's Chrome port, Developer Tools front-end is being served from the host Chrome as a Web Application from the Web Server.
- It fetches HTML, JavaScript and CSS files over HTTP
- Once loaded, Developer Tools establishes a Web Socket connection to its host and starts interchanging JSON messages with it.
In this scenario, you can substitute Developer Tools front-end with your own implementation. Instead of navigating to the HTML page at http://localhost:9222, your application can discover available pages by issuing the following HTTP request to the browser:
and getting a JSON object with information about inspectable pages along with the WebSocket addresses that you could use in order to start instrumenting them.
Note that we are currently working on exposing an HTTP-based protocol that does not require client WebSocket implementation.
Remote debugging is especially useful when debugging remote instances of the browser or attaching to the embedded devices. Blink port owners are responsible for exposing debugging connections to the external users.