{% extends "_templates/projectpage_v2.html" %}
{# This is the index.html file for your docset's Project Page. #}
{# The "extends" line above imports the standard template file. You must have the /content/en/_templates #}
{# directory checked out in your client for this to work! Run: #}
{# g4 client -a //depot/google3/googledata/devsite/content/en/_templates/... #}
{# and then 'g4 sync' #}
{% block metatags %}
{# USE THIS BLOCK FOR META TAGS THAT SHOULD APPEAR IN IF ANY. #}
{% endblock %}
{% block variables %}
{# USE THIS BLOCK FOR YOUR VARIABLES, IF ANY. YOU MAY USE 'SETVAR' AND/OR 'INCLUDE' HERE. #}
{% include "chrome-developer-tools/_local_variables.html" %}
{% endblock %}
{% block carouselcontrol %}
{%setvar carouselenabled %}1{%endsetvar%} {# SETTING THIS VARIABLE TO 0 DISABLES THE CAROUSEL COMPLETELY. #}
{# THE CAROUSEL SHOWS UP TO 5 SLIDES. "1" MEANS ON, "0" MEANS OFF. #}
{%setvar carousel1enabled%}1{%endsetvar%}
{%setvar carousel2enabled%}1{%endsetvar%}
{%setvar carousel3enabled%}1{%endsetvar%}
{%setvar carousel4enabled%}0{%endsetvar%}
{%setvar carousel5enabled%}0{%endsetvar%}
{# USE THESE VARIABLES TO CONFIGURE EACH SLIDE YOU ARE USING. IGNORE THE ONES YOU REMOVED FROM ABOVE. #}
{# link: the page the red button will link to #}
{# image: the 1128x367 pixel image to display #}
{# imgalt: alt text for accessibility #}
{# header: text to overlay in the upper-left #}
{# summary: (longer) text to overlay in the bottom-left #}
{# button: text to show on the button, if you don't like "Learn more" #}
{# darkpic: 0/1 boolean, determines what colour text should be used for the overlays #}
{%setvar carousel1link%}/chrome-developer-tools/docs/elements{%endsetvar%}
{%setvar carousel1image%}/chrome-developer-tools/images/slide8.jpg{%endsetvar%}
{%setvar carousel1imgalt%}Developer Tools{%endsetvar%}
{%setvar carousel1header%}Debug the Web.{%endsetvar%}
{%setvar carousel1summary%}Inspect, debug and optimize Web applications.{%endsetvar%}
{%setvar carousel1button%}Start now{%endsetvar%} {# DEFAULTS TO "LEARN MORE" #}
{%setvar carousel1darkpic%}1{%endsetvar%} {# "1" FOR DARK IMAGES, "0" FOR LIGHT IMAGES. #}
{%setvar carousel2link%}http://youtu.be/3pxf3Ju2row?t=28m53s{%endsetvar%}
{%setvar carousel2image%}/chrome-developer-tools/images/slide3.jpg{%endsetvar%}
{%setvar carousel2imgalt%}Developer Tools{%endsetvar%}
{%setvar carousel2header%}Optimize your apps.{%endsetvar%}
{%setvar carousel2summary%}Get rid of jank, deliver smooth apps.{%endsetvar%}
{%setvar carousel2button%}Watch video{%endsetvar%}
{%setvar carousel2darkpic%}0{%endsetvar%} {# "1" FOR DARK IMAGES, "0" FOR LIGHT IMAGES. #}
{%setvar carousel3link%}/chrome-developer-tools/docs/profiles{%endsetvar%}
{%setvar carousel3image%}/chrome-developer-tools/images/slide2.jpg{%endsetvar%}
{%setvar carousel3imgalt%}Developer Tools{%endsetvar%}
{%setvar carousel3header%}Profile your apps.{%endsetvar%}
{%setvar carousel3summary%}Profile CPU, memory and CSS.{%endsetvar%}
{%setvar carousel3button%}Learn more{%endsetvar%}
{%setvar carousel3darkpic%}0{%endsetvar%} {# "1" FOR DARK IMAGES, "0" FOR LIGHT IMAGES. #}
{%setvar carousel4link%}/time-travel-stefanoc/guide/forward{%endsetvar%}
{%setvar carousel4image%}/time-travel-stefanoc/images/slide4.jpg{%endsetvar%}
{%setvar carousel4imgalt%}White light{%endsetvar%}
{%setvar carousel4header%}Brilliant!{%endsetvar%}
{%setvar carousel4summary%}Oh yes! Humans with that little something extra that makes you
simply brilliant!!{%endsetvar%}
{%setvar carousel4button%}{%endsetvar%} {# DEFAULTS TO "LEARN MORE" #}
{%setvar carousel4darkpic%}0{%endsetvar%} {# "1" FOR DARK IMAGES, "0" FOR LIGHT IMAGES. #}
{%setvar carousel5link%}/time-travel-stefanoc/terms{%endsetvar%}
{%setvar carousel5image%}/time-travel-stefanoc/images/slide5.jpg{%endsetvar%}
{%setvar carousel5imgalt%}Galaxy{%endsetvar%}
{%setvar carousel5header%}See the stars.{%endsetvar%}
{%setvar carousel5summary%}Advanced features let you steer clear of black holes. Unless you're
into that sort of thing...{%endsetvar%}
{%setvar carousel5button%}{%endsetvar%} {# DEFAULTS TO "LEARN MORE" #}
{%setvar carousel5darkpic%}1{%endsetvar%} {# "1" FOR DARK IMAGES, "0" FOR LIGHT IMAGES. #}
{% endblock %}
{% block features %}
{%setvar featurecolumns%}0{%endsetvar%} {# NUMBER OF COLUMNS FOR UNDER-CAROUSEL PROMOS: 0, 1, 2, 3, OR 4. #}
{%setvar feature1%}
{# HTML FOR PROMO BOX 1 (IF USED). MULTI-LINE OK. #}
Get up to speed
Our new "Discover DevTools" course is live on CodeSchool! NEW
{%endsetvar%}
{%setvar feature2%}
{# HTML FOR PROMO BOX 2 (IF USED). MULTI-LINE OK. #}
Keep informed
Read our blogs, browse the forum or check the Chrome Developers G+ page
{%endsetvar%}
{%setvar feature3%}
{# HTML FOR PROMO BOX 3 (IF USED). MULTI-LINE OK. #}
Events
API Office Hours are held on the 15th day of every month in 2937. Join us then!
{%endsetvar%}
{%setvar feature4%}
{# HTML FOR PROMO BOX 4 (IF USED). MULTI-LINE OK. #}
Allons-y!
I leave the words scattered throughout time and space. The Bad Wolf API extensions make it possible.
{%endsetvar%}
Overview
The DevTools, bundled in Chrome, provide web developers deep access into the
internals of the browser and their web application. This overview of the Developer Tools points out its most popular and useful
features. The target audience are web developers who don't know of, or have not
yet investigated, the DevTools. However, we are sure that even if you are an
experienced web developer, you will pick up some tips.
Note: If you are a web developer and want to get the latest version of
DevTools, you should use Google Chrome Canary.
How To Access The DevTools
To access the DevTools, open a web page or web app in Google Chrome. Then take
one of the following actions:
- Select the Hotdog menu
 at the top-right of your browser window, then select
Tools -> Developer tools.
- Right-click on any page element and select Inspect element.
- A number of useful shortcuts are also available for opening the DevTools:
- Ctrl + Shift + I (Mac: ⌥⌘I) keys to open Developer Tools
- Ctrl + Shift + J (Mac: ⌥⌘J) to open Developer Tools and bring
focus to the Console.
- Ctrl + Shift + C (Mac: ^⌘C) to toggle Inspect Element mode.
For your day to day workflow, you will find learning the
shortcuts an effective time-saver.
The DevTools Window
The DevTools are organised into task-oriented groups in the toolbar at the top
of the window. Each toolbar item and corresponding panel let you work with a
specific type of page or app information, including DOM elements, resources, and
sources.

Overall, there are eight main groups of tools available view Developer Tools:
Elements, Resources, Network, Sources, Timeline, Profiles, Storage, Audits, and
Console. You can use the Ctrl + [ and Ctrl + ] shortcuts to move
between panels.
The Elements panel lets you see
everything in one DOM tree, and allows inspection and on-the-fly editing of DOM
elements. You will often visit the Elements tabs when you need to identify the
HTML snippet for some aspect of the page. For example, you may be curious if an
image has an HTML id attribute, and what that attribute's value is.

Read more about inspecting the DOM and styles
The JavaScript Console provides two
primary functions for developers testing web pages and applications:
- A place to log diagnostic information using methods provided by the Console
API, such as
console.log(),
or console.profile().
- A shell prompt where you can enter commands and interact with the document and
the Chrome DevTools. You can evaluate expressions directly in the Console, and
can also use the methods provided by the Command Line
API, such as
$() command for
selecting elements, or
profile() to start the
CPU profiler.

Read more about working with the console
As the complexity of JavaScript applications increase, developers need
powerful debugging tools to help quickly discover the cause of an issue and fix
it efficiently. The Chrome DevTools include a number of useful tools to help
make debugging JavaScript less painful.

Read more about how to debug JavaScript with the DevTools
The Network panel provides insights into resources that are requested and
downloaded over the network in real time. Identifying and addressing those requests taking longer than expected is an essential step in optimizing your page.

Read more about how to improve your network performance
Audits
The Audit panel can analyze a page as it loads and provide suggestions and
optimizations for decreasing page load time and increase perceived (and real)
responsiveness. For further insight, we recommend also installing the PageSpeed extension.
The Timeline panel gives you a complete overview of where time is spent when
loading and using your web app or page. All events, from loading resources to
parsing JavaScript, calculating styles, and repainting are plotted on a
timeline.

Read more about how to improve rendering performance
The Profiles panel lets you profile the execution time and memory usage of a
web app or page. The Profiles panel includes a few profilers: a CPU
profiler, a JavaScript profiler and a Heap profiler. These help you to
understand where resources are being spent, and so help you to optimize your
code:
- The CPU profiler shows where execution time is spent in your page's
JavaScript functions.
- The Heap profiler shows memory distribution by your page's JavaScript
objects and related DOM nodes.
- The JavaScript profile shows where execution time is spent in your scripts

Read more about using how to improve JavaScript and CSS performance
The Resources panel lets you inspect resources that are loaded in the
inspected page. It lets you interact with HTML 5 Database, Local Storage,
Cookies, AppCache, etc.

Read more about inspecting storage resources
Further Reading
There are several other areas of the DevTools documentation that you might find of benefit to review. These include:
Further Resources
Get More
To more tips on the DevTools watch our regular show The
Breakpoint
on YouTube.

You can also follow us on @ChromiumDev or ask a question using the forums.

or checkout the Google Chrome Developers
G+ page.

|
Take The Course
Explore and master the DevTools with our free "Discover DevTools" coursen on Code School.

Get Involved
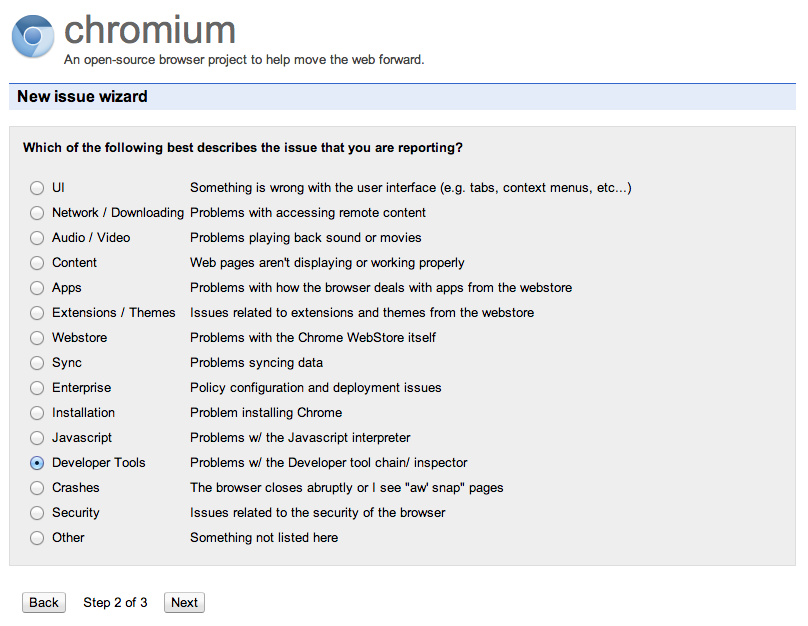
To submit a bug or a feature request on DevTools, please use issue tracker at
http://crbug.com. Please also mention "DevTools" in the bug
summary.

Anyone can also help make the DevTools better be directly
contributing back to the source.
Debugging Extensions
Looking to use the DevTools to debug Chrome extensions? Watch Developing and
Debugging extensions or read the
Debugging
tutorial.
|
{% endblock %}
 at the top-right of your browser window, then select
Tools -> Developer tools.


