Part of GitHub code security scanning |
||
|---|---|---|
| .github/workflows | ||
| Antlr4.Runtime | ||
| CtfPlayback | ||
| CtfUnitTest | ||
| Images | ||
| LTTngCds | ||
| LTTngDataExtUnitTest | ||
| LTTngDataExtensions | ||
| LTTngDriver | ||
| Launcher/Windows | ||
| LinuxLogParsers | ||
| PerfCds | ||
| PerfDataExtensions | ||
| PerfUnitTest | ||
| ReleaseFiles | ||
| TestData | ||
| UnitTestCommon | ||
| grammar | ||
| .gitignore | ||
| CODE_OF_CONDUCT.md | ||
| LICENSE | ||
| LinuxTraceLogCapture.md | ||
| Microsoft-Perf-Tools-Linux.sln | ||
| NOTICE.md | ||
| README.md | ||
| SECURITY.md | ||
| SUPPORT.md | ||
| azure-pipelines.yml | ||
README.md
Microsoft Performance Tools Linux
This repo contains various Linux Performance Analysis tools built with the Microsoft Performance Toolkit SDK.
Tools are built with open source .NET Core and can be run on the cmd-line or in the WPA GUI. All the logs that are supported are open source.
Not only are the raw logs parsed, but a lot of smart post processing / correlation is done to make your life easier as a perf analyst. We hope you can solve & debug tough issues on you or your customers systems with this toolset!
Tracing supported: LTTng (Kernel CPU scheduling, Processes, Threads, Block IO/Disk, Syscalls, File events, etc), perf CPU Sampling(cpu-clock)
Logs supported: Dmesg, Cloud-Init, WaLinuxAgent
Presentations
If you want to see a demo or get more in-depth info on using these tools check out a talk given at the Linux Tracing Summit:
Prerequisites
Runtime prereqs
Dev prereqs
- .NET Core SDK 3.1.x
- Visual Studio, VSCode, or your favorite editor!
Download
See Releases
How to run the tools
The tools can be run in several modes:
-
Cross-platform with .NET Core
- Used as a library to process traces / logs programatically
- With a driver program for example dumping to screen or text format
- ./LTTngDriver.exe LTTng-Kernel-Trace.ctf (trace folder is zipped and renamed to .ctf)
- ./LTTngDriver.exe LTTngKernelTraceFolder (not currently working - blocked on Issue #6)
-
(Windows Only - Install) Using the WPA GUI to load these tools as plugins
- Download the latest Windows Performance Toolkit (WPT) that comes in the ADK Preview
- Note: In the future, the WPA team plans to make it easier to install WPA outside of the ADK
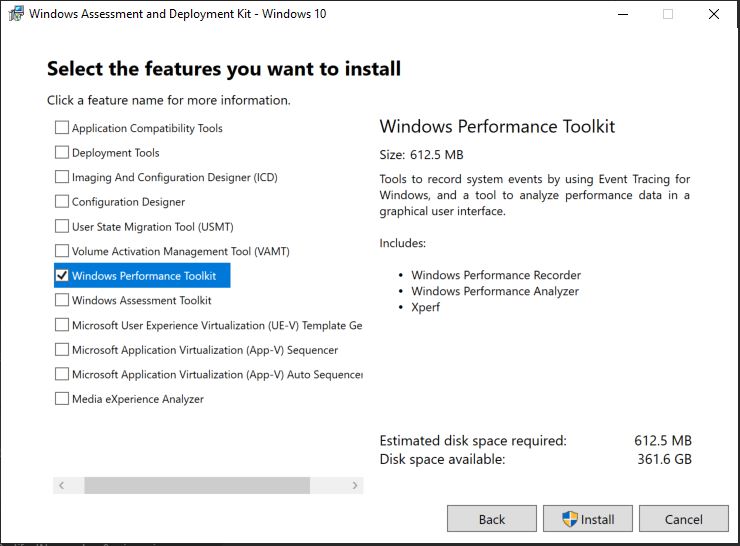
- Install Windows Performance Toolkit

- Verify that this WPA version supports plugins
- In Command Prompt
"C:\Program Files (x86)\Windows Kits\10\Windows Performance Toolkit\wpa.exe" /? - Verify that these 2 command line WPA options are supported:
- OPTIONS: -addsearchdir PATH. Adds a directory path to the plugin search path. ....
- ENVIRONMENT VARIABLES: WPA_ADDITIONAL_SEARCH_DIRECTORIES - A semicolon (;) delimited list of additional directories to search for plugins. Equivalent to the -addsearchdir option.
- Download the latest Windows Performance Toolkit (WPT) that comes in the ADK Preview
-
(Windows Only - Run) Using the WPA GUI to load these tools as plugins
- WPA needs to be told where to find these additional plugins.
- Using Windows Launcher. -LinuxPerfToolsPluginFolder path may need to be specified
.\LaunchWpaPerfToolsLinux.ps1 -i c:\PATH\TO\lttng-kernel-trace.ctf - In Command Prompt with -addsearchdir and -i trace file:
"C:\Program Files (x86)\Windows Kits\10\Windows Performance Toolkit\wpa.exe" -addsearchdir %HOMEDRIVE%%HOMEPATH%\Downloads\Microsoft-Performance-Tools-Linux-0.8\Microsoft-Performance-Tools-Linux\MicrosoftPerfToolkitAddins -i c:\PATH\TO\lttng-kernel-trace.ctf - OR with Env Variable to pick file from UI (Env variable not currently working in current ADK version)
 SET WPA_ADDITIONAL_SEARCH_DIRECTORIES=%HOMEDRIVE%%HOMEPATH%\Downloads\Microsoft-Performance-Tools-Linux-0.8\Microsoft-Performance-Tools-Linux\MicrosoftPerfToolkitAddins
 "C:\Program Files (x86)\Windows Kits\10\Windows Performance Toolkit\wpa.exe"
-
(Coming soon) (Windows) Command-line dumping to a text format (say CSV)
How to capture a trace or logs
Please see Linux Trace Log Capture
How to load the logs in the UI
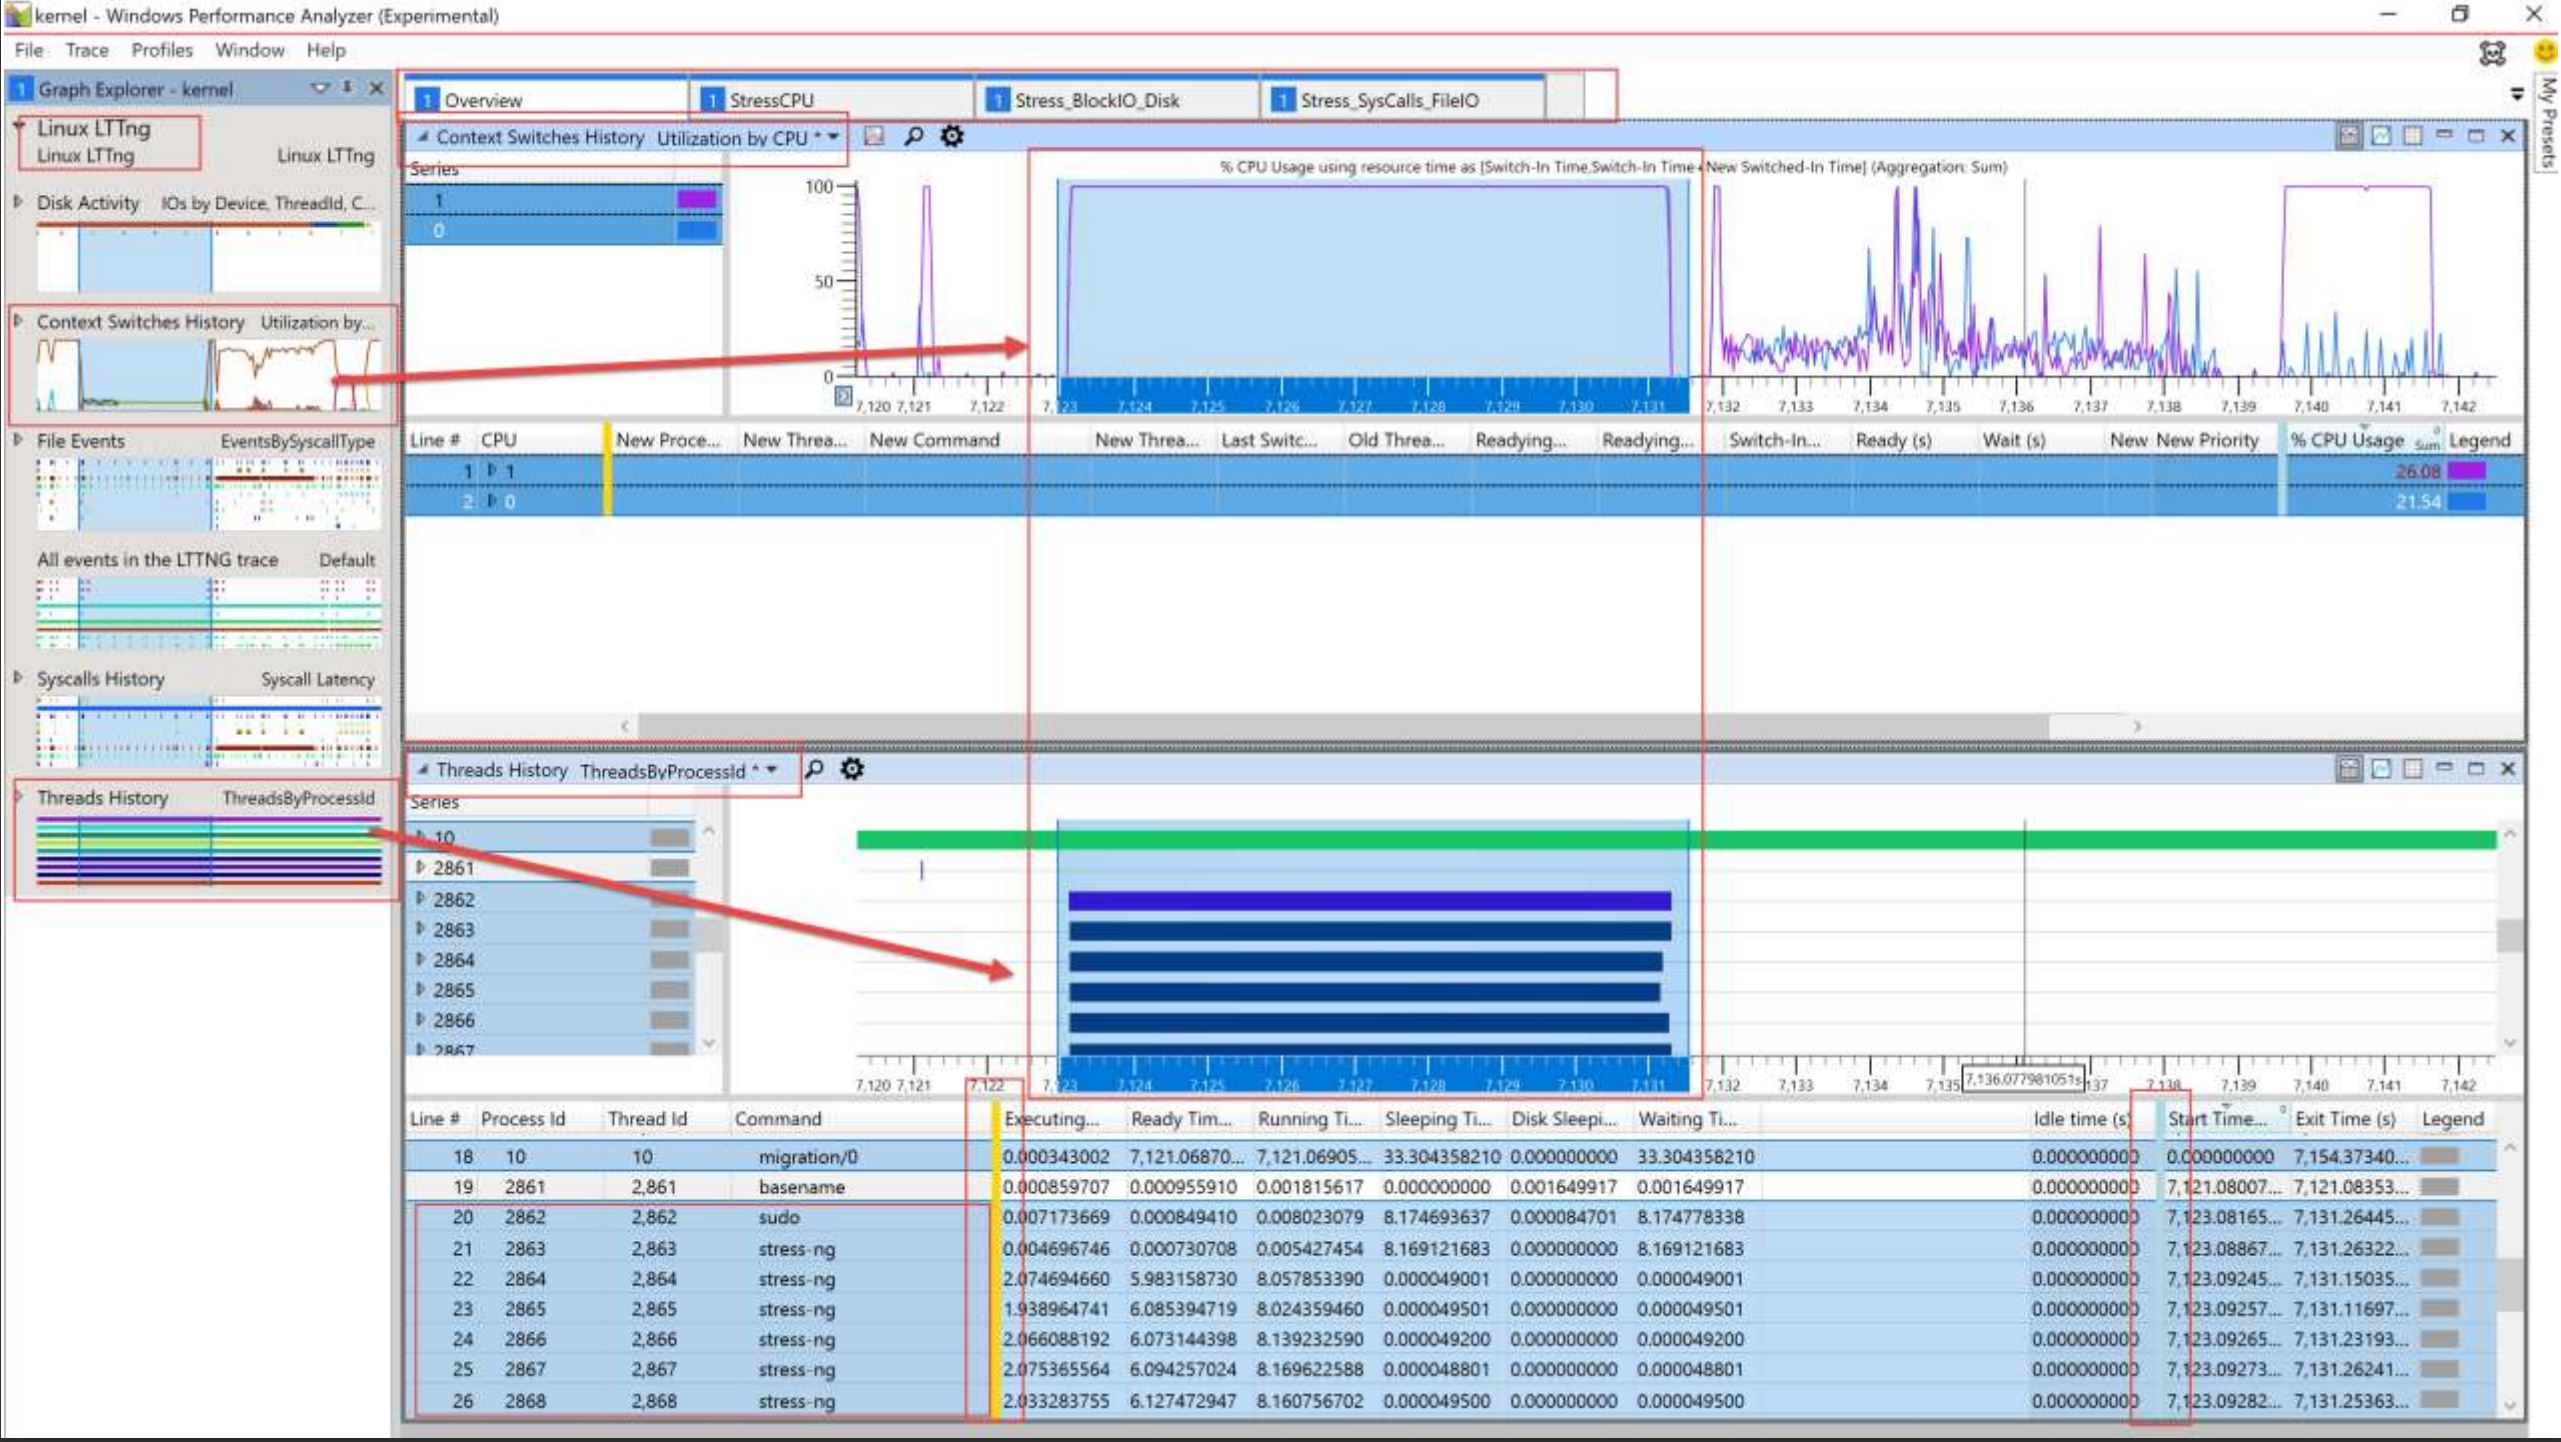
Once you gather the data, there is a tiny bit of prep needed to open them in a single unified timeline (like the screenshot above)
- LTTng - If you just need to open only a LTTng trace by itself in folder format
- WPA -> Open -> Folder (Select CTF folder)
- Unified (LTTng or other multiple different logs files together)
- If you want to open other logs together in single timeline - Copy other Linux logs you want to open to single folder
- Example: You want to open in the same timeline: LTTng, Perf CPU Sampling, Dmesg
- Ensure that the Linux CTF folder/trace is zipped and renamed to .ctf in the same folder (hack so open Unified works)
- WPA -> File -> Open -> Multi-select all files and choose "Open Unified"
How do I use WPA in general?
If you want to learn how to use the GUI UI in general see WPA MSDN Docs
Contributing
This project welcomes contributions and suggestions. Most contributions require you to agree to a Contributor License Agreement (CLA) declaring that you have the right to, and actually do, grant us the rights to use your contribution. For details, visit https://cla.opensource.microsoft.com.
When you submit a pull request, a CLA bot will automatically determine whether you need to provide a CLA and decorate the PR appropriately (e.g., status check, comment). Simply follow the instructions provided by the bot. You will only need to do this once across all repos using our CLA.
This project has adopted the Microsoft Open Source Code of Conduct. For more information see the Code of Conduct FAQ or contact opencode@microsoft.com with any additional questions or comments.
Trademarks
This project may contain trademarks or logos for projects, products, or services. Authorized use of Microsoft trademarks or logos is subject to and must follow Microsoft's Trademark & Brand Guidelines. Use of Microsoft trademarks or logos in modified versions of this project must not cause confusion or imply Microsoft sponsorship. Any use of third-party trademarks or logos are subject to those third-party's policies.
