|
|
||
|---|---|---|
| .. | ||
| images | ||
| src | ||
| .eslintrc.json | ||
| .gitignore | ||
| .vscodeignore | ||
| README.md | ||
| extension.webpack.config.js | ||
| package.json | ||
| package.nls.json | ||
| tsconfig.json | ||
| yarn.lock | ||
README.md
SQL Server Profiler for Azure Data Studio
Welcome to the SQL Server Profiler for Azure Data Studio! The SQL Server Profiler extension provides a simple SQL Server tracing solution similar to SSMS Profiler except built using XEvents. SSMS Profiler is very easy to use and has good default values for the most common tracing configurations. The UX is optimized for browsing through events and viewing the associated T-SQL text. The SQL Server Profiler for Azure Data Studio also assumes good default values for collecting T-SQL execution activities with an easy to use UX.
Common SQL Profiler use-cases taken from https://docs.microsoft.com/en-us/sql/tools/sql-server-profiler/sql-server-profiler.
- Stepping through problem queries to find the cause of the problem.
- Finding and diagnosing slow-running queries.
- Capturing the series of Transact-SQL statements that lead to a problem.
- Monitoring the performance of SQL Server to tune workloads.
- Correlating performance counters to diagnose problems.
Getting Started:
To launch SQL Server Profiler, you have to first make a connection to a server.
Open Profiler by pressing Alt+P on Windows, and Ctrl+Alt+P on macOS.
To Start/Stop Profiler, click the Start button or press Alt+S on Windows, or Ctrl+Alt+S on macOS.
Otherwise, open the command palette and type 'Profiler.'
For more info, check out our documentation.
SQL Server Profiler 0.1.1 Release
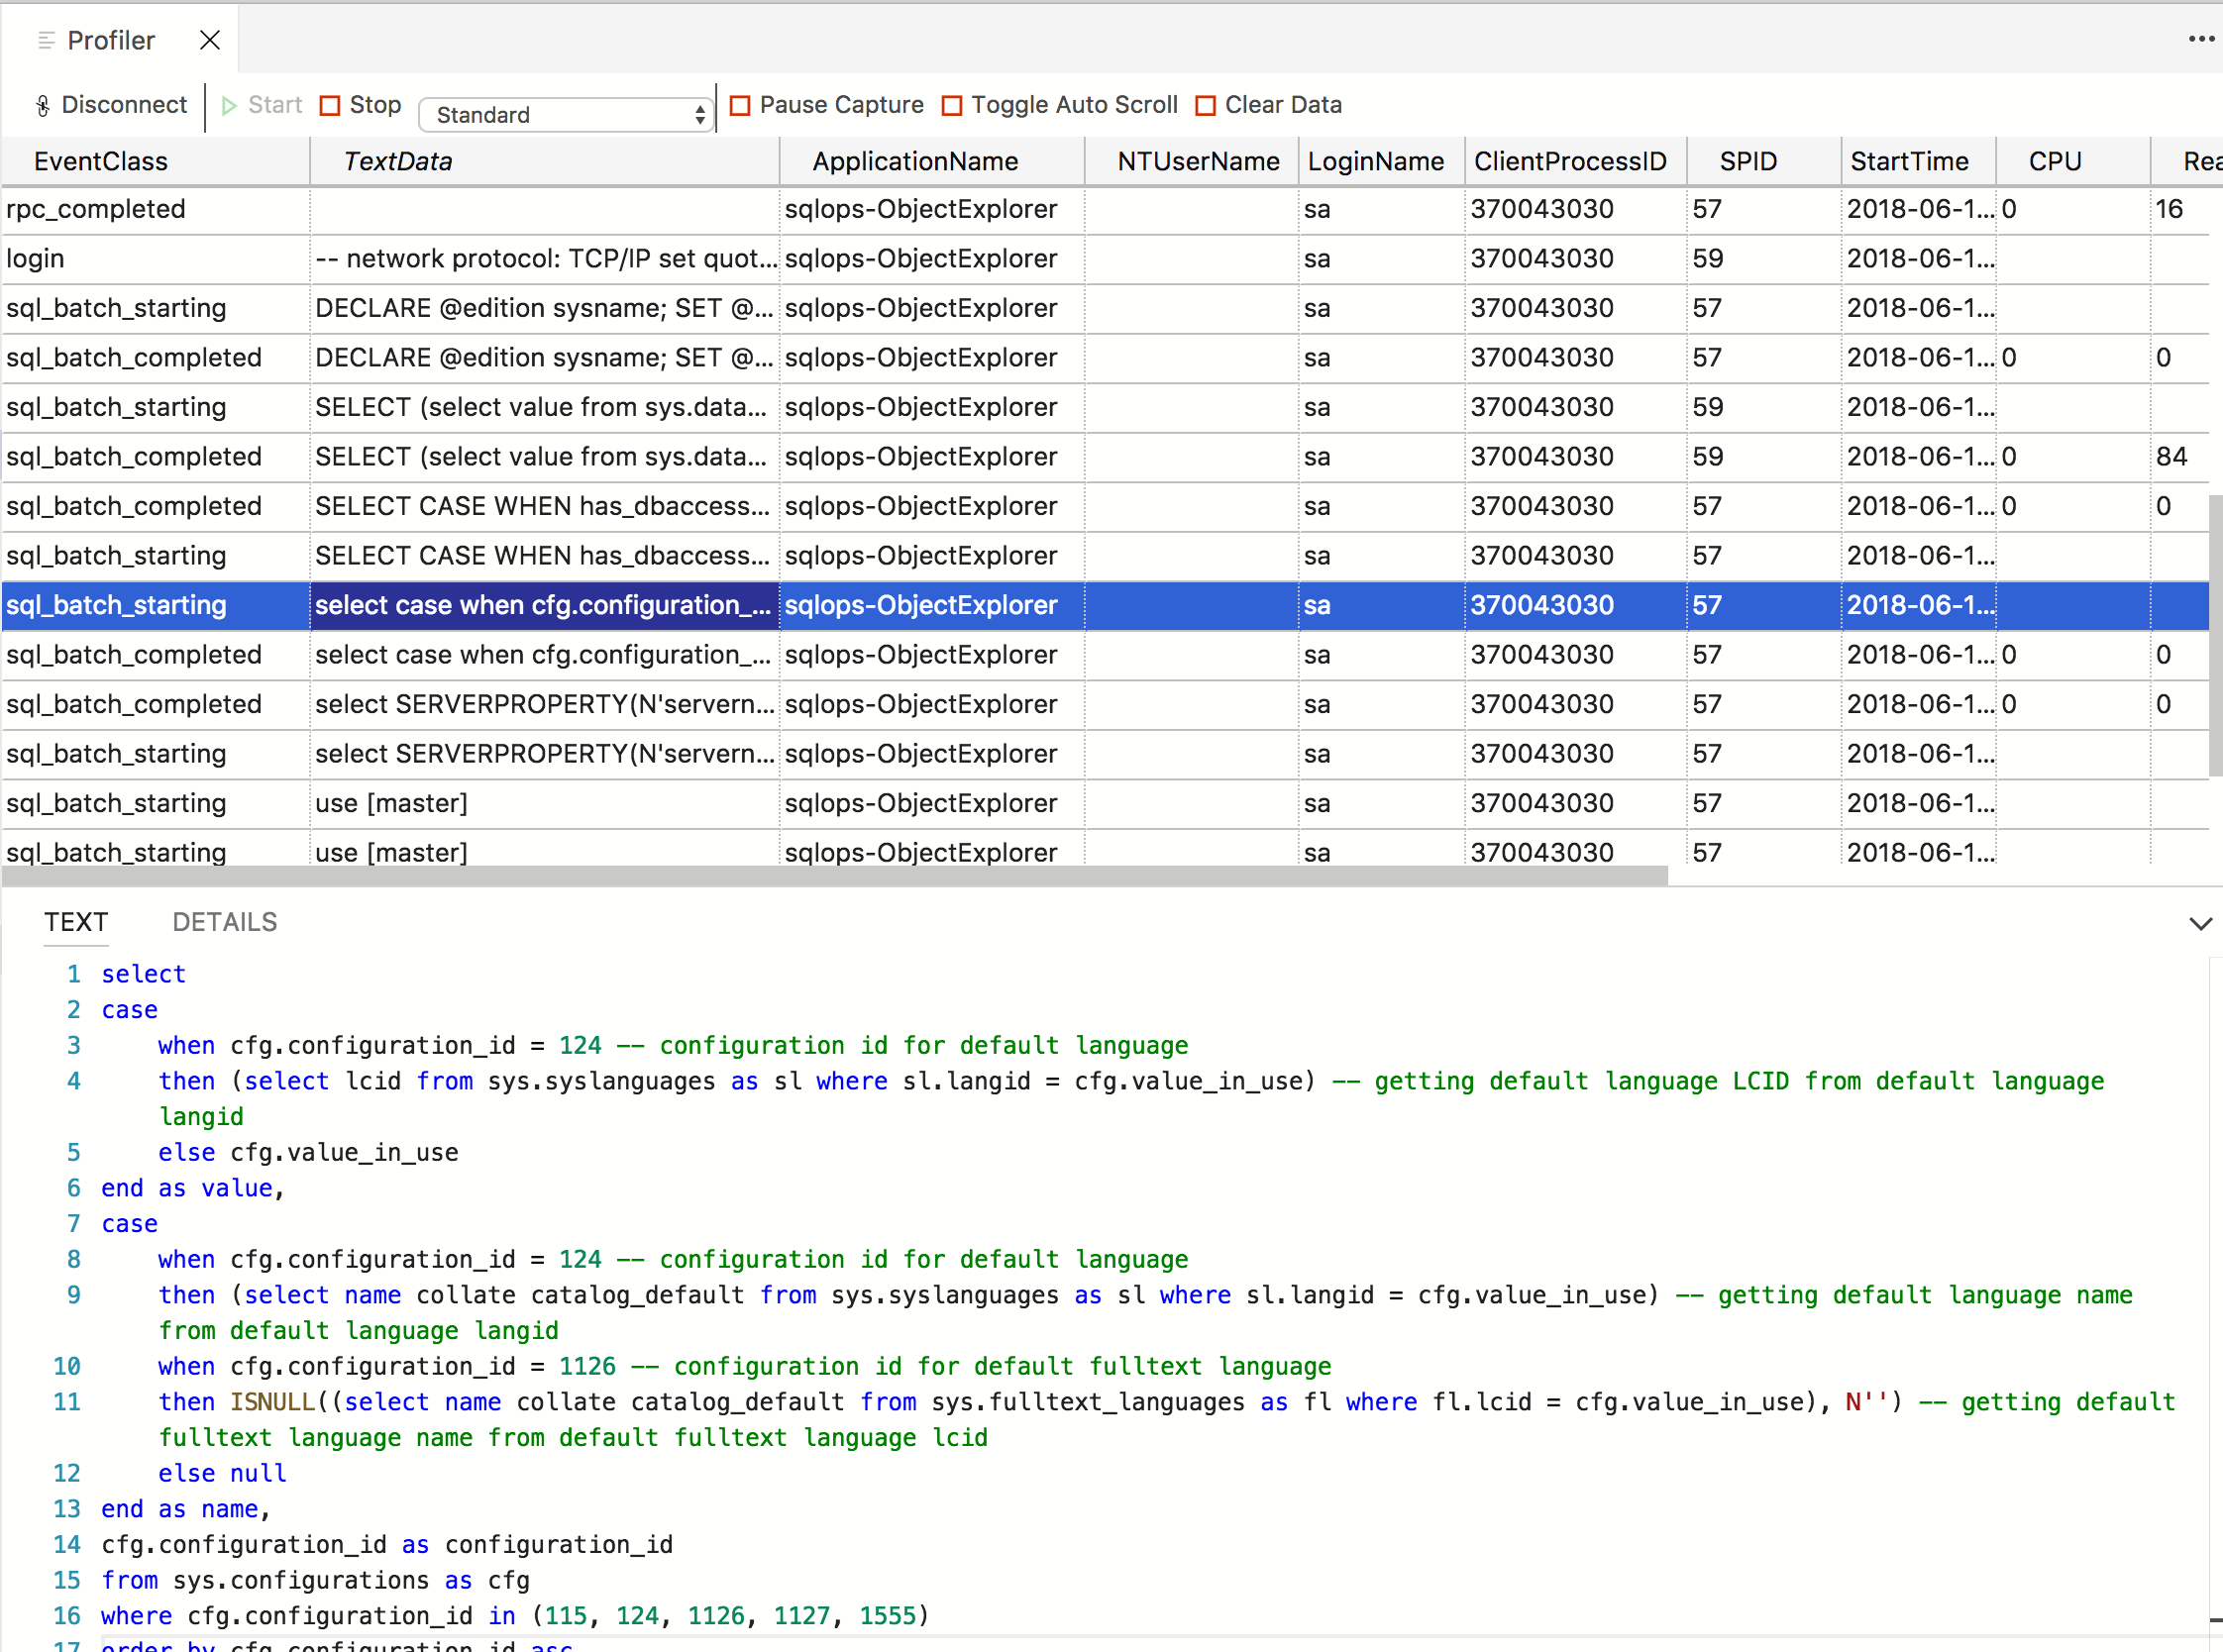
The SQL Server Profiler for Azure Data Studio Preview extension is now available. This is the initial preview release for a new lightweight XEvent-based profiler. The SQL Server Profiler extension tries to make it simple to quickly trace server activity for troubleshooting and monitoring.
We'll continue to enhance this extension over the next couple releases. Take a look at the below screenshot to see what's currently available.

Code of Conduct
This project has adopted the Microsoft Open Source Code of Conduct. For more information see the Code of Conduct FAQ or contact opencode@microsoft.com with any additional questions or comments.
Privacy Statement
To learn more about our Privacy Statement visit this link.
License
Copyright (c) Microsoft Corporation. All rights reserved.
Licensed under the Source EULA.