|
|
||
|---|---|---|
| .. | ||
| Images | ||
| Source Files | ||
| README.md | ||
README.md
Paginated Reports In An Hour 
Paginated reports are designed to be printed or shared. They're called paginated because they're formatted to fit well on a page. They display all the data in a table, even if the table spans multiple pages. They're also called pixel perfect because you can control their report page layout exactly. Power BI Report Builder is the standalone tool for authoring paginated reports for the Power BI service.
Prerequisites
For this workshop a Power BI Pro or Premium Per User license and access to a workspace (recommended non-production) is needed to upload the sample Power BI dataset.
Follow Along:
Setup
Power BI service
- Navigate to the Power BI service.
- Within the Power BI service, select the Workspaces option within the navigation menu and locate a workspace that is backed by either Premium Capacity or Premium Per User.
- Within the Workspace:
- Select New and the Upload a file option
- Within Create new content, select Local file and upload the Contoso_Sample.pbix
Power BI Report Builder
- Navigate to the View tab and check the Properties, Parameters and Grouping options if they are not currently enabled.
Query Designer
Objective - Connect to a Data Source and create a Dataset using the Power BI Dataset Connection.
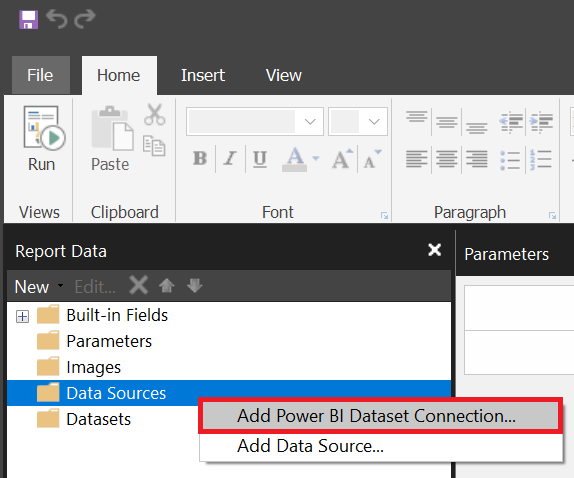
- Within the Report Data pane, right click the Data Sources option and select Add Power BI Dataset Connection...
-
Within the Select a dataset from the Power BI service window navigate to the workspace the Contoso_Sample.pbix was uploaded to and press Select to create a connection.
-
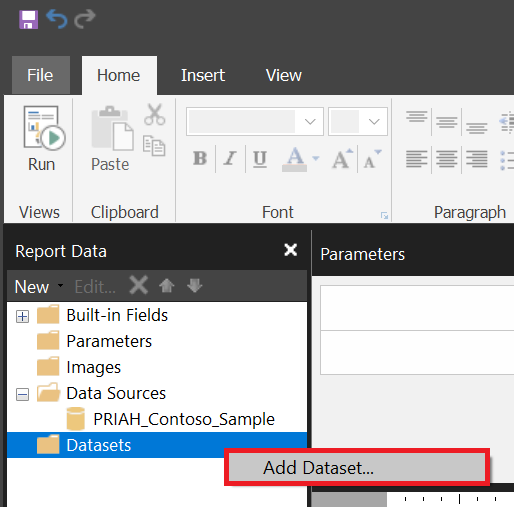
Within the Report Data pane, right click the Datasets option and select Add Dataset...
- In the Dataset Properties window and the Query group update or select the following:
- Update the Name: property to Sales.
- Within the Data source: option select Power BI dataset connection from your Data Sources list.
- Select Query Designer...
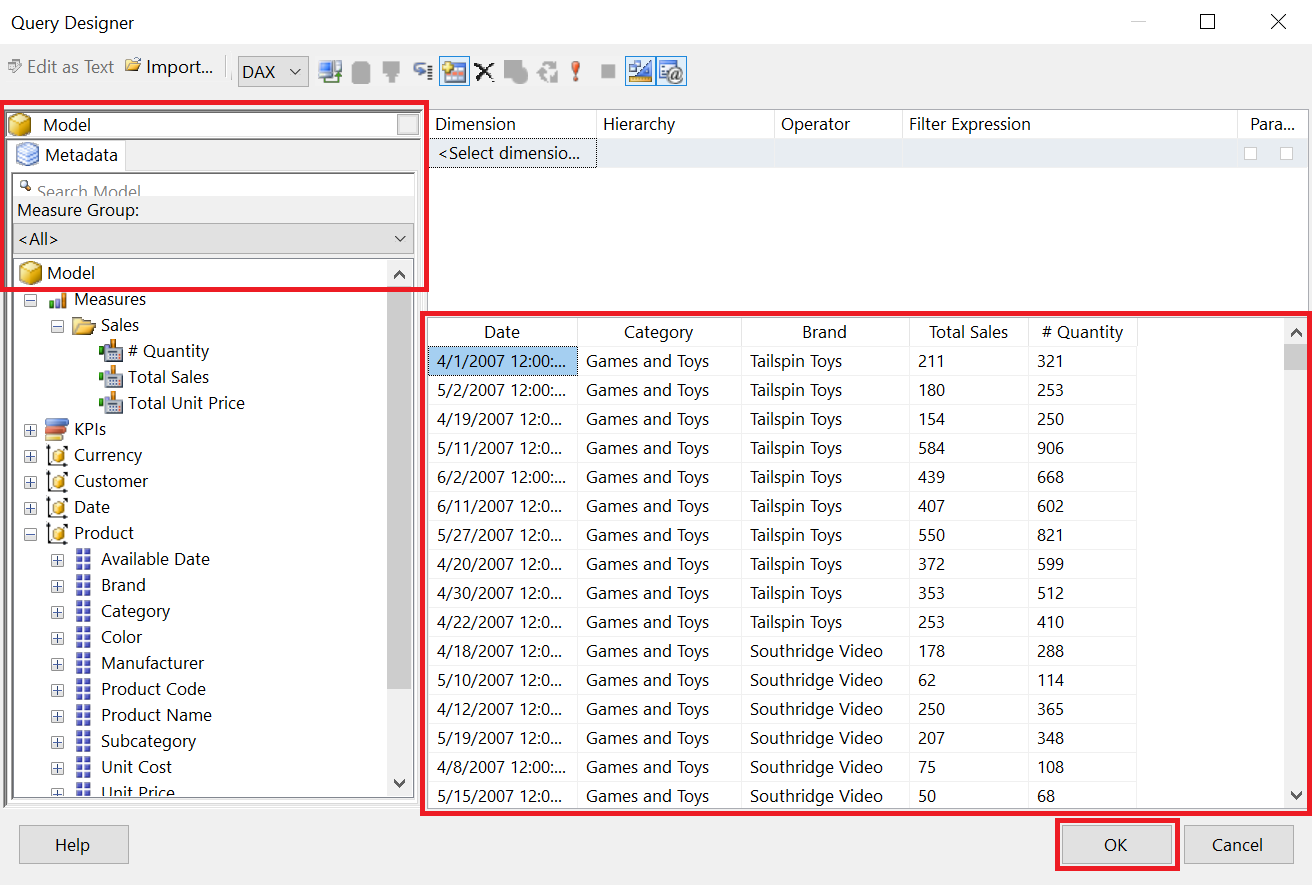
- In the Query Designer window add the following fields and measures to the grid from the Model view and press OK when complete.
| Date | Category | Brand | Total Sales | # Quantity | |
|---|---|---|---|---|---|
| Object | Date[Date] | Product[Category] | Product[Brand] | Measures (Sales) - [Total Sales] | Measures (Sales) - [# Quantity] |
- A system generated query has now been written into the Dataset Properties field, press OK to continue.
- ⚠ Important Note you can edit this text by pressing the fX option or write your own custom query without the use of the Query Designer.
Table
Objective - Create and format a table including alternate row colors
- Select the dark grey area within the report designer and in the Properties pane update the Left and Right margins to 0.5.
- Within the ribbon navigate to the Insert tab, select Table and the Insert Table option.
- Add the following fields to the table by either dragging and dropping from the Datasets group or by selecting the details symbol

Date Category Brand Total Sales ID Quantity Date Category Brand Total_Sales ID__Quantity
-
Update the column header for ID Quantity to Total Quantity.
-
Resize the following columns Width and Height, within the Properties pane in the Position category.
Category Brand Size 2.25, 0.25 1.5, 0.25 -
Format the following columns from the Home tab.
Date Total Sales Total Quantity Date Currency Number -
Select the Date column header and with the table object now being the active object select the entire header row by clicking the all selection to the left.
-
Within the Properties set the following properties:
- Fill group BackgroundColor
- Font group Color
- Navigate to the ribbon, select the Home tab and the Run (F5) button.
- Within the Run tab select the Print Layout to view the output if the report was to be printed.
- Select the Design (F8) button to return to design view.
- Navigate to the Insert tab, select Header and the Add Header option.
- Within the report canvas move the current text box to the header region and update to Contoso Sales Results and then Bold the text.
- Select the table object and the cell selector in the top left to edit the Tablix properties.
- Position group:
- Left 0in
- Top 0in
- Position group:
❗ Important: Tablix = Table, List, Matrix
- Right click the [Total_Sales] value and select Add Total.
- Select the empty cell in the total row in the Total Quantity column and select the [ID__Quantity] column to automatically generate the expression [Sum(ID__Quantity)].
- Select the empty cell in the total row in the Date column, add the text Grand Total and then Bold.
- Within the text box [&ExecutionTime] right click, select Expression... and update the current expression to concatenate the following text.
="Run Time: " & Globals!ExecutionTime
-
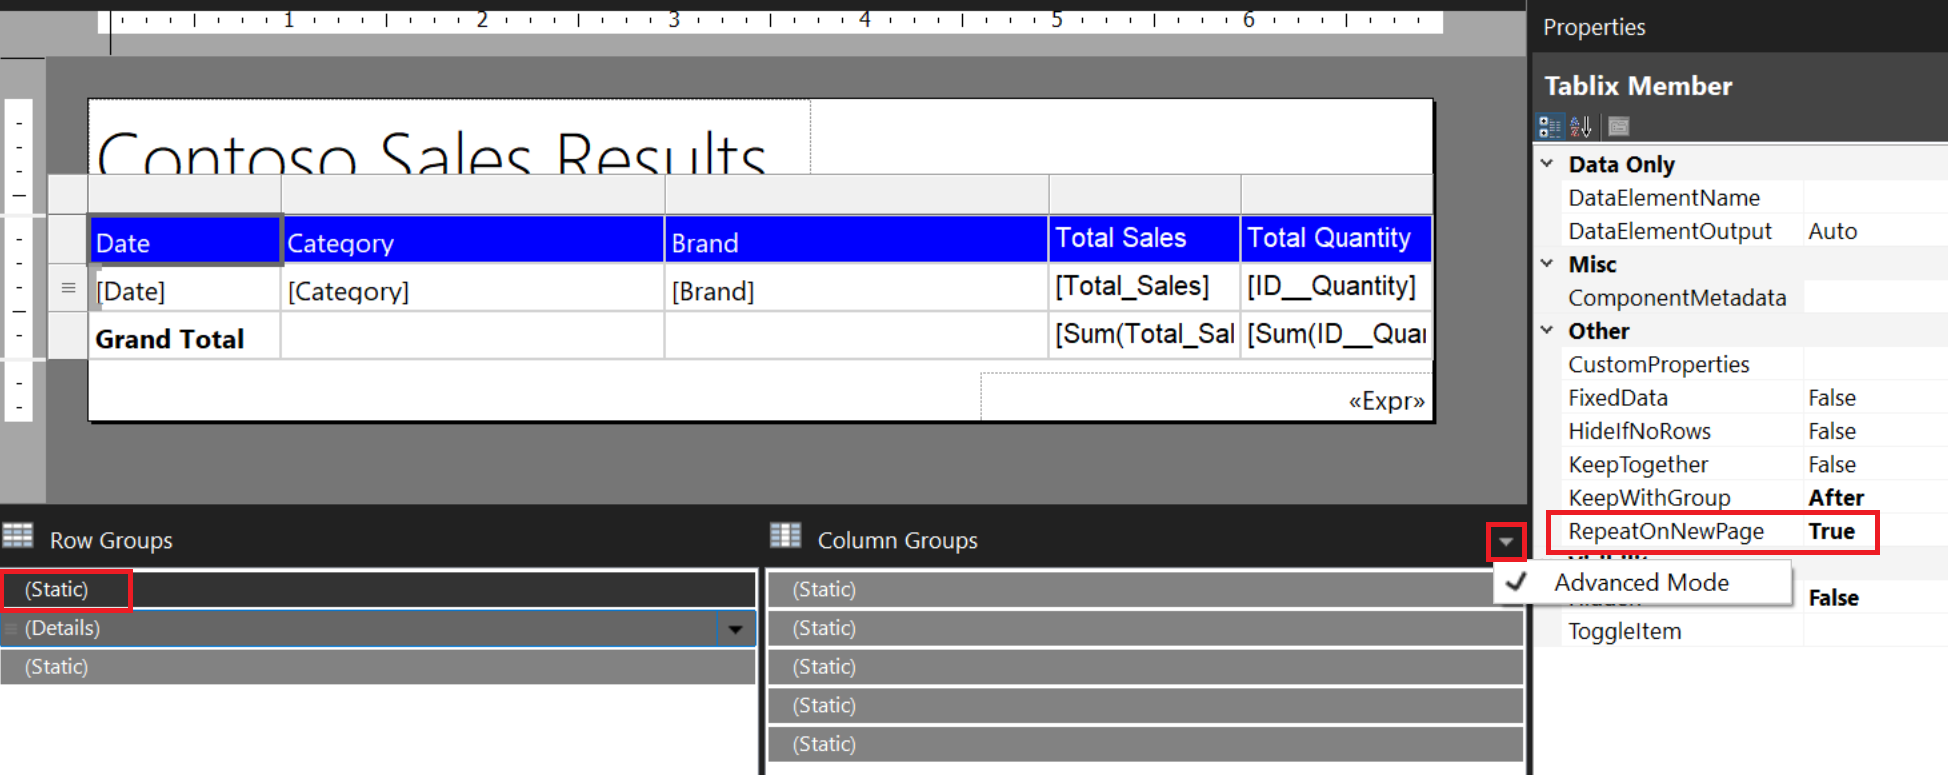
Within the Grouping pane select the 🔽 option and enable Advanced Mode.
-
Within the Row Groups update the following properties:
- Select the first (Static) option, navigate to the Properties pane and update the RepeatOnNewPage property to True
- Right click (Details), select Group Properties, navigate to the Sorting group, Add a sorting option to Sort by [Date] Order Z to A and then press OK when complete.
-
Select the table object and the cell selector in the rows field to the left to edit the Tablix Member objects properties.
- Fill group:
- BackgroundColor Expression...
- Include the following expression below:
=IIF( RowNumber(Nothing) Mod 2 = 1 , "No Color","Silver" )
- Fill group:
- Remove any excess spacing between the header, body and footer of the report page.
- Navigate to the ribbon, select the Home tab and the Run (F5) button.
Parameters and Expressions
Objective - Add a parameter and a custom expression.
- Within the Report Data pane, right click the Sales dataset and select Query.
- Within the Query Designer window set the following properties:
Dimension Hierarchy Operator Filter Expression Parameters Product Brand Equal Contoso ✅
-
Within the Report Data pane, expand the Parameters folder, right click the ProductBrand parameter and select Parameter Properties.
-
Within the Report Parameter Properties window update the following configurations and press OK when complete:
- General group, deselect Allow blank values("") and Allow multiple values.
- Default Values group, select No default value.
-
Navigate to the ribbon, select the Home tab and the Run (F5) button.
-
From the Brand parameter, select Adventure Works and press View Report.
-
Select the Design (F8) button to return to design view.
-
Right click the text box within the header and select Expression..
-
Within the Expression window complete the following and press OK when complete:
- Remove the current text within the Value field.
- Within the Category: listing to the Parameters group and double click to select the ProductBrand from Values: field.
-
Update the expression value to match the below text:
=Parameters!ProductBrand.Value & " Sales Results" -
Update the current text box width to extend to the current page size.
-
Navigate to the ribbon, select the Home tab and the Run (F5) button.
-
From the Brand parameter, select any brand and press View Report.
Groups and Sparklines
Objective - Using the table wizard create a grouped table and add Sparklines
-
Within the Report Data pane, right click the Datasets option and select Add Dataset...
-
In the Dataset Properties window and the Query group update or select the following:
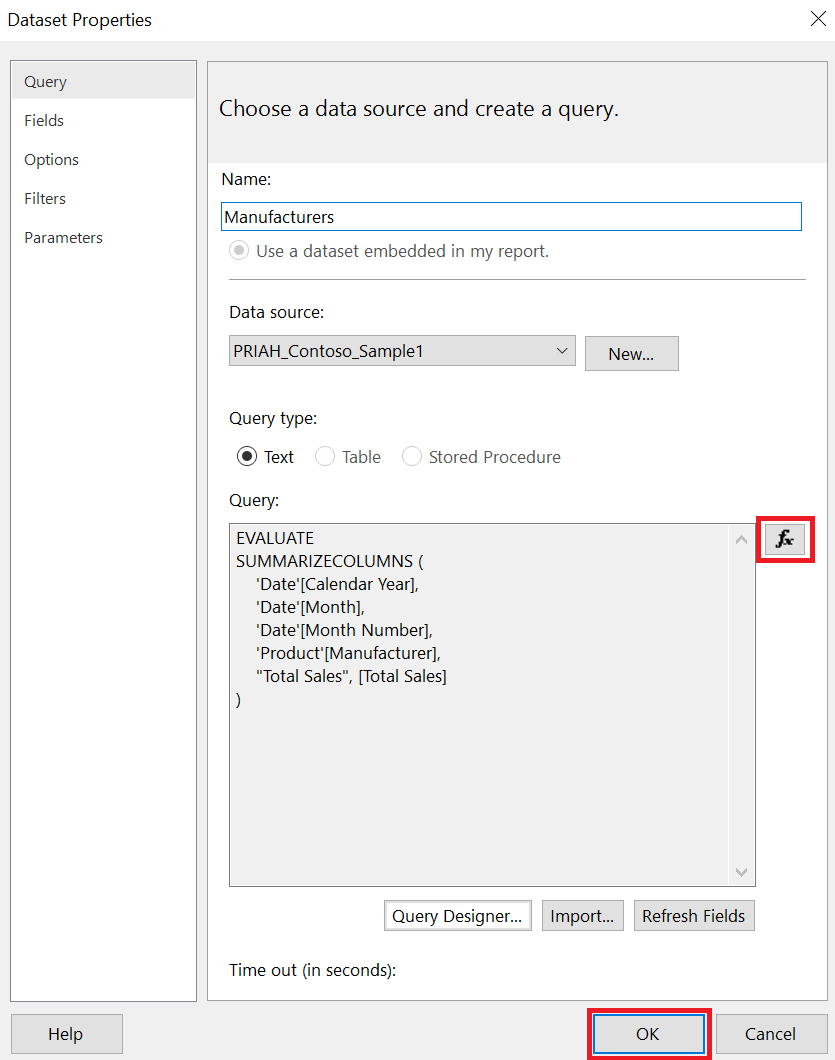
- Update the Name: property to Manufacturers.
- Within the Data source: option select Power BI dataset connection from your Data Sources list.
- Press the Fx icon, insert the below DAX query and press OK in the Expression window.
EVALUATE SUMMARIZECOLUMNS ( 'Date'[Calendar Year], 'Date'[Month], 'Date'[Month Number], 'Product'[Manufacturer], "Total Sales", [Total Sales] ) -
Press Refresh Fields and then navigate to the Fields group.
-
Update the Field Name results as shown in the table below and then press OK to exit.
Field Name Field Source Calendar_Year Date[Calendar Year] Month Date[Calendar Year Month Number] Month_Number Date[Month Number] Manufacturer Product[Manufacturer] Total_Sales [Total Sales] -
Navigate to the Insert tab and expand the Matrix option to select the Matrix Wizard.
-
From the New Table or Matrix window complete the following steps:
- select the Manufacturers dataset and then press Next >.
- Arrange the fields in the following groups or values.
Field Area Calendar_Year Row groups Manufacturer Row groups Column groups Month Values Total_Sales -
From the Values group select the chevron next to Total_Sales, set to Sum and then press Next >
- Leave the default Layout with subtotal below, press Next >
- Press Finish >>
-
Holding ctrl select all the [Sum(Total_Sales)] values in the matrix and set the formatting to Currency within the Number group on the Home tab.
-
Navigate to the ribbon, select the Home tab and the Run (F5) button.
-
Select the Design (F8) button to return to design view.
-
Bold the text and values in the Manufacturer total row.
-
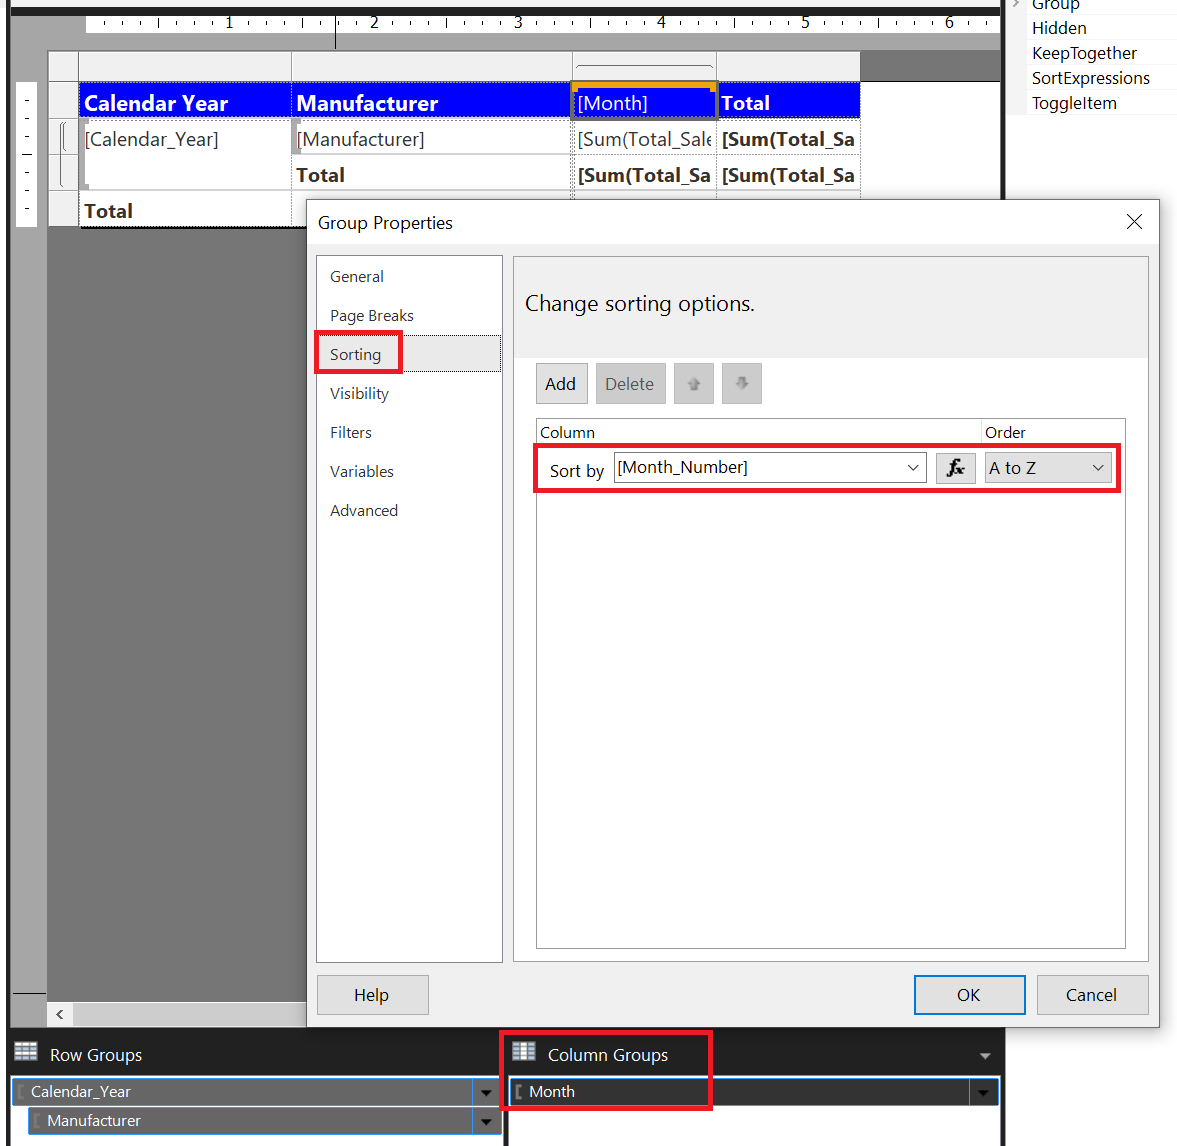
From the Column Groups right click the Month group and select Group Properties...
-
Within the Group Properties window navigate to Sorting, select Add and change the sort to [Month_Number] and then press OK.
-
Navigate to the ribbon, select the Home tab and the Run (F5) button.
-
Select the Design (F8) button to return to design view.
-
Right click the Month column in the Matrix and select Outside Group - Right to add a new chart and within the headers add the title Trend.
-
Navigate to the Insert tab, select Sparkline and within the Select Sparkline Type select the Smooth Line With Markers option and then press OK.
-
Click anywhere on the report to add the Sparkline and then select the object to get the Chart Data menu and complete the following.
- Within Category Groups add the Month_Number column.
- Within Values add the Total_Sales measure, select the chevron to the right and change the Aggregate to Sum
- Select the Sparkline object, copy (Ctrl+C) and paste into the Matrix within the first two empty cells of the Trend column.
- Delete the original Sparkline chart when complete.
- Right click the second Sparkline within the Matrix, choose Chart Properties and complete the following within the window:
- Navigate to the Visibility group and enable the Display can be toggled by this report item:
- Choose the value Calendar_Year
- Press OK when complete.
- Navigate to the ribbon, select the Home tab and the Run (F5) button.
Conditional formatting
Objective - Add dynamic indicators and parameters
-
Navigate to the Parameters group within the Report Data pane and add the following parameters and rearrange accordingly to ensure the proper order within the Parameters pane:
Name Prompt Date type StartDate Start Date Date/Time EndDate End Date Date/Time Threshold Threshold Integer -
Within the Report Data pane, right click the Datasets option and select Add Dataset...
-
In the Dataset Properties window and the Query group update or select the following:
- Update the Name: property to Occupations.
- Within the Data source: option select Power BI dataset connection from your Data Sources list.
- Press the Fx icon, insert the below DAX query and press OK in the Expression window.
EVALUATE SUMMARIZECOLUMNS ( Customer[Occupation], KEEPFILTERS ( FILTER ( ALL ( 'Date'[Date] ), 'Date'[Date] >= DATE ( 2007, 1, 1 ) && 'Date'[Date] <= DATE ( 2007, 12, 31 ) ) ), "Total Sales", [Total Sales] ) -
Press Refresh Fields and then navigate to the Fields group.
-
Update the Field Name results as shown in the table below and then press OK to exit.
Field Name Field Source Occupation Customer[Occupation] Total_Sales [Total Sales] -
Navigate to the Parameters group and press Add to add the following values:
Parameter Name Parameter Value StartDate [@StartDate] EndDate [@StartDate] -
Navigate back to the Query group and press the Fx icon to update the Query to include the StartDate and EndDate parameters as displayed below and then press OK:
EVALUATE SUMMARIZECOLUMNS ( Customer[Occupation], KEEPFILTERS ( FILTER ( ALL ( 'Date'[Date] ), 'Date'[Date] >= @StartDate && 'Date'[Date] <= @EndDate ) ), "Total Sales", [Total Sales] ) -
Right click on the report page, select Insert, Table and then add the following fields Occupation and Total_Sales.
-
Within the Row Groups right click the Details, select Delete Group and within the dialog window select Delete group only and then OK.
-
Right click and delete the third empty column from the table if still present.
-
Right click the header row from the table and select Delete Rows
-
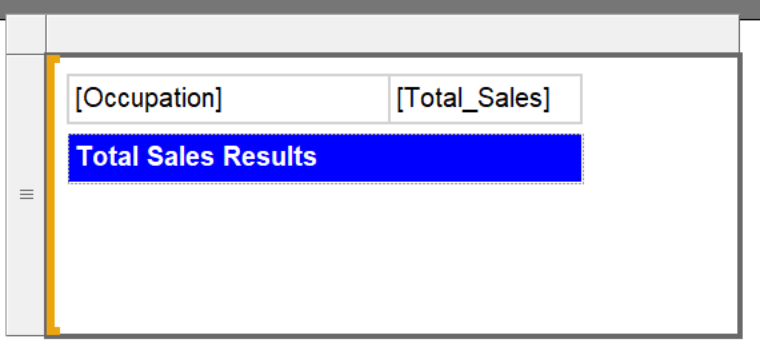
Right click on the report page and select Insert, List and then within the Properties pane for the Tablix (Table, List, Matrix) update the DataSetName property to the Occupations datasets.
-
Drag the table into the list object.
-
Right click within the list object and select Insert, Text Box and then add the following text Total Sales Results and stylize the background and font color.
-
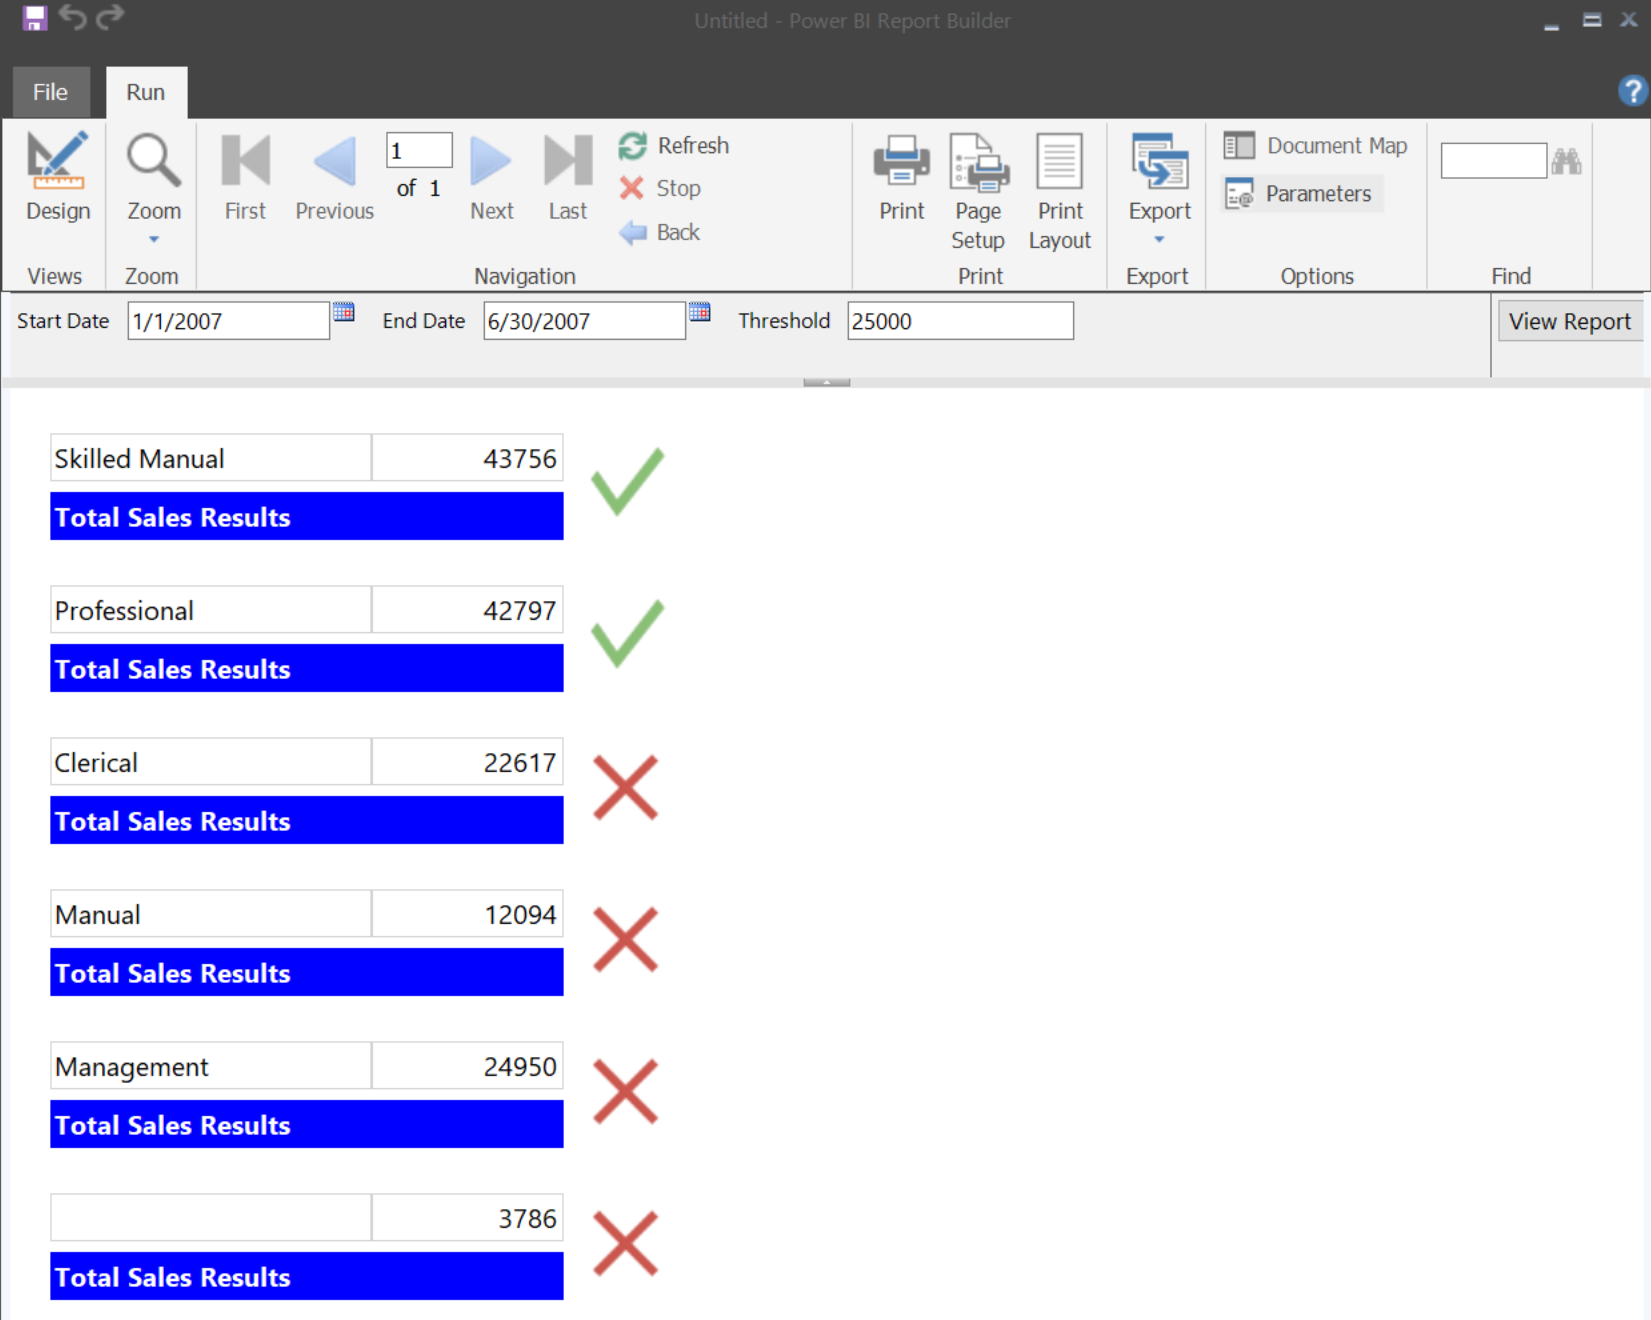
Navigate to the ribbon, select the Home tab and the Run (F5) button. Complete the parameter values and press View Report when complete.
- Recommend Start Date as 1/1/2007, End Date as 12/31/2007 and Threshold 25000 - these can also be set as default values.
-
Select the Design (F8) button to return to design view.
-
Right click within the list object and select Insert, Indicator and select 3 Symbols (Uncircled) and then press OK.
-
Right click the indicator and select Indicator Properties and within the dialog window update the following properties.
- Within the Value and States group:
-
Value: equals [SUM(Total_Sales)]
-
States Measurement Unit: equals Numeric
-
Within the indicators select the middle value (Exclamation point) and select Delete
-
Within the ❌ value, select the Fx icon next to the End value and within the Expression dialog window, select the Parameters category, the Threshold parameter and then OK.
-
Within the ✔ value select the Fx icon next to the following values and update accordingly within the Expression dialog window:
- Start value and the following expression.
= Parameters!Threshold.Value + 1- End value and the following expression.
=Max(Fields!Total_Sales.Value) -
Press OK when complete.
-
- Within the Value and States group:
-
Navigate to the ribbon, select the Home tab and the Run (F5) button. Complete the parameter values and press View Report when complete.
- Recommend Start Date as 1/1/2007, End Date as 12/31/2007 and Threshold 25000 - these can also be set as default values.
Continue Your Journey
Paginated Reports in a Day
The Power BI Paginated Reports in a Day video-based course empowers you as a report author with the technical knowledge required to create, publish, and distribute Power BI paginated reports. It comprises almost 4 hours 20 minutes of viewable content—available on demand, and is free of charge.
Source: Microsoft Docs
Paginated Report Recipes
This e-book is a revision, in part, of the original SQL Server Reporting Services Recipes book with new content modernized to work with Power BI Paginated Reports. These recipes can be used or adapted to work with SQL Server Reporting Services, Power BI Report Server or the Power BI Service in Premium Capacity (or Premium per User licensing).
2021 (c) Paul Turley, with contributions from multiple authors
Source: Paul Turley's SQL Server BI Blog
Twelve Days of Paginated Reports
Laura Graham-Brown provides a video playlist for those getting started with Paginated Reports and some "Art-of-the-Possible" that extend into subscriptions alongside Power Automate.
Source: YouTube
