7.4 KiB
Testing ARO Monitor Metrics
The Monitor Architecture
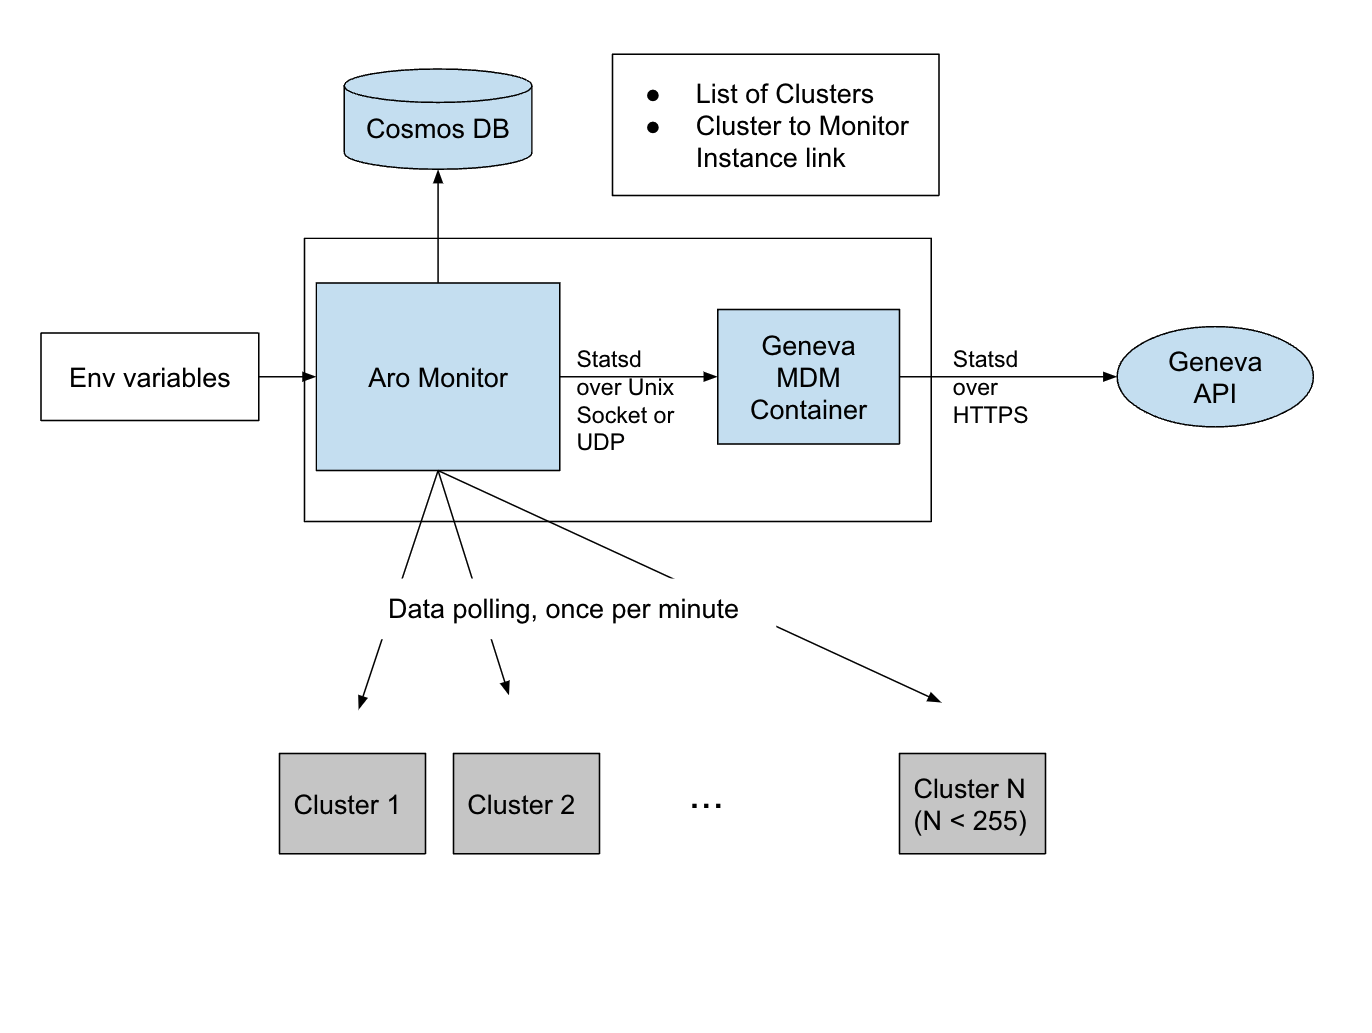
The ARO monitor component (the part of the aro binary you activate when you execute ./cmd/aro monitor) collects and emits the various metrics about cluster health (and its own) we want to see in Geneva.
To send data to Geneva the monitor uses an instance of a Geneva MDM container as a proxy of the Geneva API. The MDM container accepts statsd formatted data (the Azure Geneva version of statsd, that is) over a UNIX (Domain) socket. The MDM container then forwards the metric data over a https link to the Geneva API. Please note that a Unix socket can only be accessed from the same machine.
The monitor picks the required information about which clusters should actually monitor from its corresponding Cosmos DB. If multiple monitor instances run in parallel (i.e. connect to the same database instance) as is the case in production, they negotiate which instance monitors what cluster (see : monitoring.md).
Unit Testing Setup
If you work on monitor metrics in local dev mode (RP_MODE=Development) you most likely want to see your data somewhere in Geneva INT (https://jarvis-west-int.cloudapp.net/) before you ship your code.
There are two ways to set to achieve this:
- Run the Geneva MDM container locally
- Spawn a VM, start the Geneva container there and connect/tunnel to it.
and two protocols to chose from:
- Unix Domain Sockets, which is the way production is currently (April 2022) run
- or UDP, which is much easier to use and is the way it will be used on kubernetes clusters in the future
Local Container Setup
Before you start, make sure :
- to run
source ./env - you ran
SECRET_SA_ACCOUNT_NAME=rharosecretsdev make secretsbefore - know which "account" and "namespace" value you want to use on Geneva INT for your metric data and update your env to set the following variables before you start the monitor:
- CLUSTER_MDM_ACCOUNT
- CLUSTER_MDM_NAMESPACE
The container needs to be provided with the Geneva key and certificate. For the INT instance that is the rp-metrics-int.pem you find in the secrets folder after running the make secrets command above.
Remote Container Setup
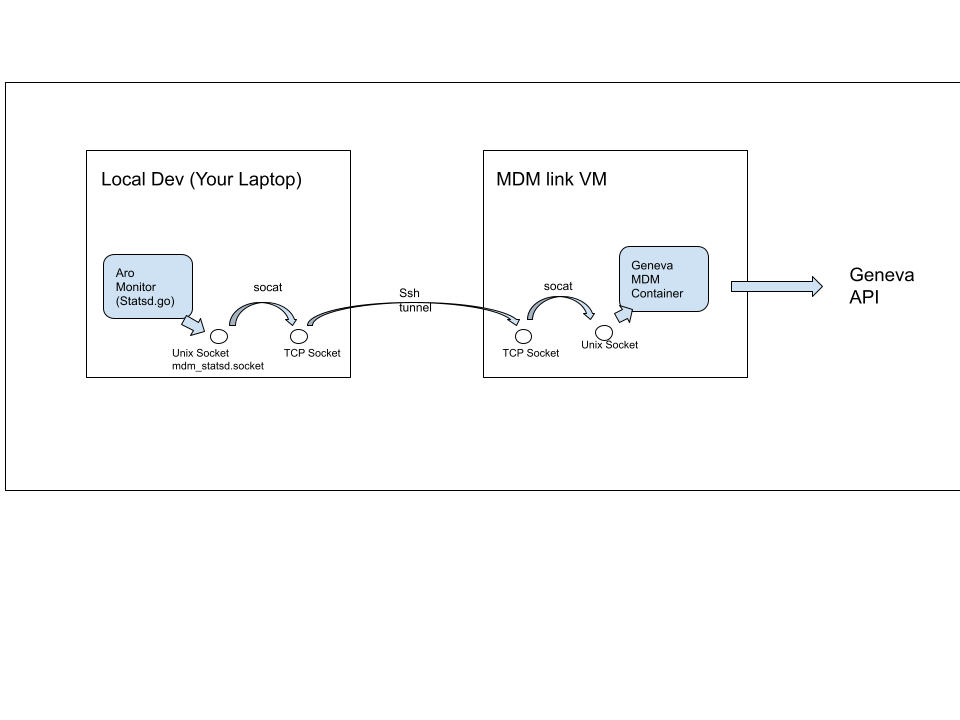
If you can't run the container locally (because you run on macOS and your container tooling does not support Unix Sockets, which is true both for Docker for Desktop or podman) and or don't want to, you can bring up the container on a Linux VM and connect via a socat/ssh chain:

Before you start make sure:
- you can ssh into the cloud-user on your VM without ssh prompting you for anything
- run
source ./env - you
az logininto your subscription - you ran
SECRET_SA_ACCOUNT_NAME=rharosecretsdev make secretsbefore - know which "account" and "namespace" value you want to use on Geneva INT for your metric data and
update your env to set the
- CLUSTER_MDM_ACCOUNT
- CLUSTER_MDM_NAMESPACE
variables before you start the monitor.
The deploy script deploys such a VM called $USER-mdm-link on Azure, configures it and installs the mdm container.
The start network script can then be used to established the network connection as depicted in the diagram.
The network script will effectively start run three commands (with more error handling):
PUBLICIP=<IP of your VM>

BASE=$( git rev-parse --show-toplevel)
SOCKETFILE=$BASE/cmd/aro/mdm_statsd.socket

ssh cloud-user@$PUBLICIP 'sudo socat -v TCP-LISTEN:12345,fork UNIX-CONNECT:/var/etw/mdm_statsd.socket'

ssh $CLOUDUSER@$$PUBLICIP -N -L 12345:127.0.0.1:12345

socat -v UNIX-LISTEN:$SOCKETFILE,fork TCP-CONNECT:127.0.0.1:12345
For debugging it might be useful to run these commands manually in three different terminals to see where the connection might break down. The docker log file should show if data flows through or not, too.
Stopping the Network script
Stop the script with Ctrl-C. The script then will do its best to stop the ssh and socal processes it spawned.
Starting the monitor
When starting the monitor , make sure to have your
- CLUSTER_MDM_ACCOUNT
- CLUSTER_MDM_NAMESPACE
environment variables set to Geneva account and namespace where you metrics is supposed to land in Geneva INT (https://jarvis-west-int.cloudapp.net/)
Use go run ./cmd/aro monitor to start the monitor. You want to check what the current directory of your monitor is, because that's the folder the monitor will use to search for the mdm_statds.socket file and that needs to match where your mdm container or the socat command creates it. Please note that in local dev mode the monitor will silently ignore if it can't connect to the socket.
A VS Code launch config that does the same would look like.
{
            "name": "Launch Monitor",
            "type": "go",
            "request": "launch",
            "mode": "auto",
            "program": "./cmd/aro",
            "console": "integratedTerminal",
            "args": ["-loglevel=debug",
                "monitor",
            ],
            "env": {"CLUSTER_MDM_ACCOUNT": "<PUT YOUR ACCOUNT HERE>",
            "CLUSTER_MDM_NAMESPACE":"<PUT YOUR NAMESPACE HERE>"
            }
        },
Finding your data
If all goes well, you should see your metric data in the Jarvis metrics list (Geneva INT (https://jarvis-west-int.cloudapp.net/) -> Manage -> Metrics) under the account and namespace you specified in CLUSTER_MDM_ACCOUNT and CLUSTER_MDM_NAMESPACE and also be available is the dashboard settings.
Injecting Test Data into Geneva INT
Once your monitor code is done you will want to create pre-aggregates, dashboards and alert on the Geneva side and test with a variety of data. Your end-2-end testing with real cluster will generate some data and cover many test scenarios, but if that's not feasible or too time-consuming you can inject data directly into the Genava mdm container via the socat/ssh network chain.
An example metric script is shown below.
myscript.sh | socat TCP-CONNECT:127.0.0.1:12345 -
or
myscript.sh | socat UNIX-CONNECT:$SOCKETFILE -
(see above of the $SOCKETFILE )
Sample metric script
#!/bin/bash
# example metric
CLUSTER="< your testcluster example name>"
SUBSCRIPTION="<  your subscription here >"
METRIC="< your metric name>"
ACCOUNT="< your CLUSTER_MDM_ACCOUNT >"
NAMESPACE="< CLUSTER_MDM_NAMESPACE>"
DIM_HOSTNAME="<your hostname >"
DIM_LOCATION="< your region >"
DIM_NAME="pod-$CLUSTER"
DIM_NAMESPACE="< somenamespace> "
DIM_RESOURCEGROUP="< your resourcegroup> "
DIM_RESOURCEID="/subscriptions/$SUBSCRIPTION/resourceGroups/$DIM_RESOURCEGROUP/providers/Microsoft.RedHatOpenShift/openShiftClusters/$CLUSTER"
DIM_RESOURCENAME=$CLUSTER

### or read data from file, like: data=$( cat mydatafile )
data="10 11 12 13 13 13 13 15 16 19 20 21 25"
SLEEPTIME=60
for MET in $data ;do
DATESTRING=$( date -u +'%Y-%m-%dT%H:%M:%S.%3N' )
OUT=$( cat << EOF
{"Metric":"$METRIC",
"Account":"$ACCOUNT",
"Namespace":"$NAMESPACE",
"Dims":
    {"hostname":"$DIM_HOSTNAME",
    "location":"$DIM_LOCATION",
    "name":"$DIM_NAME",
    "namespace":"$DIM_NAMESPACE",
    "resourceGroup":"$DIM_RESOURCEGROUP",
    "resourceId":"$DIM_RESOURCEID",
    "resourceName":"$DIM_RESOURCENAME",
    "subscriptionId":"$SUBSCRIPTION"
},
"TS":"$DATESTRING"}:${MET}|g
EOF
)

echo $OUT
sleep $SLEEPTIME
done
