Solution Sample Update to handle multiple telemetry streams |
||
|---|---|---|
| .devcontainer | ||
| Videos | ||
| app | ||
| docs | ||
| grafana | ||
| media | ||
| .eslintrc.json | ||
| .gitignore | ||
| CONTRIBUTING.md | ||
| LICENSE.txt | ||
| README.md | ||
| SECURITY.md | ||
| docker-compose.yml | ||
README.md
Verified Telemetry Custom Solution Sample
Table of Contents
- Verified Telemetry Overview
- Steps to setup Custom Solution Template
- Steps to setup Verified Telemetry Configuration
- Consuming Verified Telemetry Information
- FAQ
- Next Steps
Verified Telemetry Overview
The quality of sensor data is fundamental for driving IoT adoption. Since IoT sensors are made of low-cost components, deployed in-the-wild and in harsh environments, they are prone to failures leading to faulty or dirty data. The effect of bad data will lead to the well-known garbage-in garbage-out process, leading to cascading ill-effects upstream and at times catastrophic decisions.
Verified Telemetry (VT) is a state-of-the-art solution to determine the health of the sensor, i.e., working or faulty, which is consequently used to determine the quality of the sensed data. This is achieved by devising an intelligent “sensor fingerprint”, a set of unique electrical characteristics that differs between working and faulty sensors. The fingerprints can detect faults for a wide variety of off-the-shelf sensors and can be easily implemented with lightweight software code running on the IoT device. This novel approach empowers customers with a reliable and automated way to remotely measure and observe the health of the sensor in real-time alongside the data collected. The data associated with a validated fingerprint results in verified telemetry (as shown below).
| Description | |
|---|---|
| Verified Telemetry Device SDK | The SDK which builds on the Azure RTOS or FreeRTOS middleware |
| Azure RTOS samples, FreeRTOS samples | These Getting Started guides shows device developers how to combine Verified Telemetry with Azure IoT and Azure RTOS or FreeRTOS. |
| Verified Telemetry Custom Solution Sample | Uses InfluxDB, Grafana and the Azure IoT Node.js SDK to communicate with Azure IoT Hub and showcase how the Verified Telemetry features can be utilized in real world scenarios. |
Steps to setup Custom Solution Template
This getting started guide will help you setup VT solution sample, which allows users to collect fingerprints on-the-fly, view telemetry data and telemetry status in a dashboard. The solution sample is developed as a docker container image, thus enabling users to seamlessly interact with VT enabled device.
Prerequisites
-
Setup one of the board specific device samples:
NOTE: Ensure your device is up and running before you proceed to the next step
NOTE: Save the Device ID that you have configured
WARNING: Ensure the IoT Hub that you are using has ZERO endpoints configured (TSI/Blob Storage etc). This solution sample requires all IoT Hub Data to be routed to the built-in Event Hub and hence if any endpoint is configured, the solution sample would not work! If there are endpoints that are configured for the IoT Hub, you need to create a new IoT Hub or you can delete all of the existing configured endpoints
Step 1: Clone the repository
To clone the repo, run the following command:
git clone --recursive https://github.com/Azure/Verified-Telemetry-Solution-Sample.git
Step 2: Setup Docker Desktop
- Steps to install Docker locally can be found here
- If you run into issues, please see Docker Troubleshooting page for more details
- Ensure Docker Desktop is up and running (click the system tray icon on the task bar to see the docker status)
Step 3: Run the Docker application
-
Install VS Code
-
Open the Extensions view (Ctrl+Shift+X), search for docker to filter results and select Docker extension authored by Microsoft.
-
Open the folder (Ctrl+K+O) Verified-Telemetry-Solution-Sample in VS Code
-
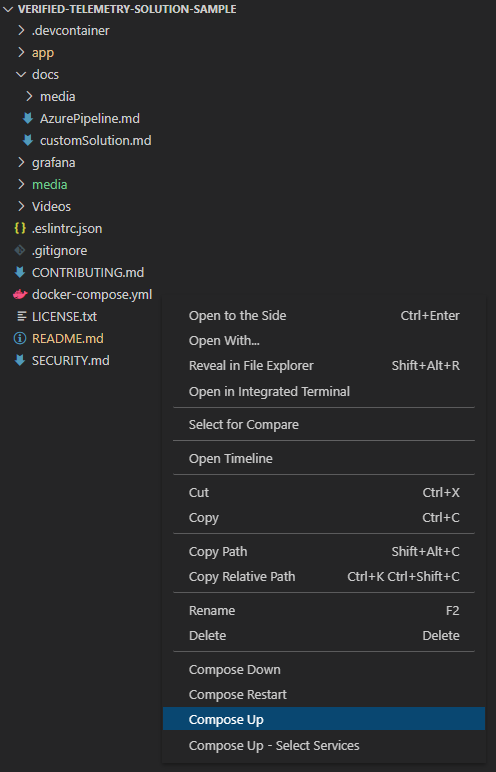
Open Explorer View (Ctrl+Shift+E), Right click on file docker-compose.yml and select Compose Up
-
Ensure notifications on your PC are ON.
-
You can potentially get a file sharing request shown below while docker creates your application. If you do get the access request, click on Share It
-
In case you update your constants.js file later, Right click on file docker-compose.yml and select Compose Restart
NOTE: If you do not want to use VS code and the docker extension, you can run the following command in the root folder Verified-Telemetry-Solution-Sample
docker-compose up -d
Step 4: Get IoT Hub Connection String
-
In your CLI console, run the az iot hub show-connection-string command to get the connection string for your IoT hub.
az iot hub show-connection-string --name {YourIoTHubName}
Step 5: Configure Azure IoT Hub and Device ID settings
This is a very important step to ensure the custom solution can fetch telemetry from Azure Event Hub and send command & property updates to your IoT Device
-
Open your browser and navigate to below URL to access the Solution Sample Configuration Form
-
Enter Azure IoT Hub Connection String and IoT Device ID and hit Save Configuration
Field Value Example IoT Hub Connection String{Your IoT Hub Connection String saved in Step 4} e.g., 'HostName=xxxxxxx.azure-devices.net; SharedAccessKeyName=iothubowner; SharedAccessKey=xxxxxxxxxxx' Device ID{Your device ID} e.g., MyMXChipDevice -
Upon successful configuration the following message would be displayed
Click on the link to navigate to the solution sample landing page
-
If an illegal IoT Hub Connection String is provided, you might see the following error message
Re-open and re-fill the configuration settings form and ensure that a valid IoT Hub Connection String is provided
Step 5: Open Solution Sample landing page
-
Open your browser and navigate to below URL
Step 6: Enter following credentials
| Credential | Default Value |
|---|---|
username |
admin |
password |
admin |
You can skip the password reset and proceed forward.
Step 7: View the Dashboard
Step 8: Select the Device From the Drop-Down Menu
- Select the device configured with Verified Telemetry, here we use SolutionSampleTestDevice as the device.

Steps to setup Verified Telemetry Configuration
Select Sensor to Monitor and Configure
-
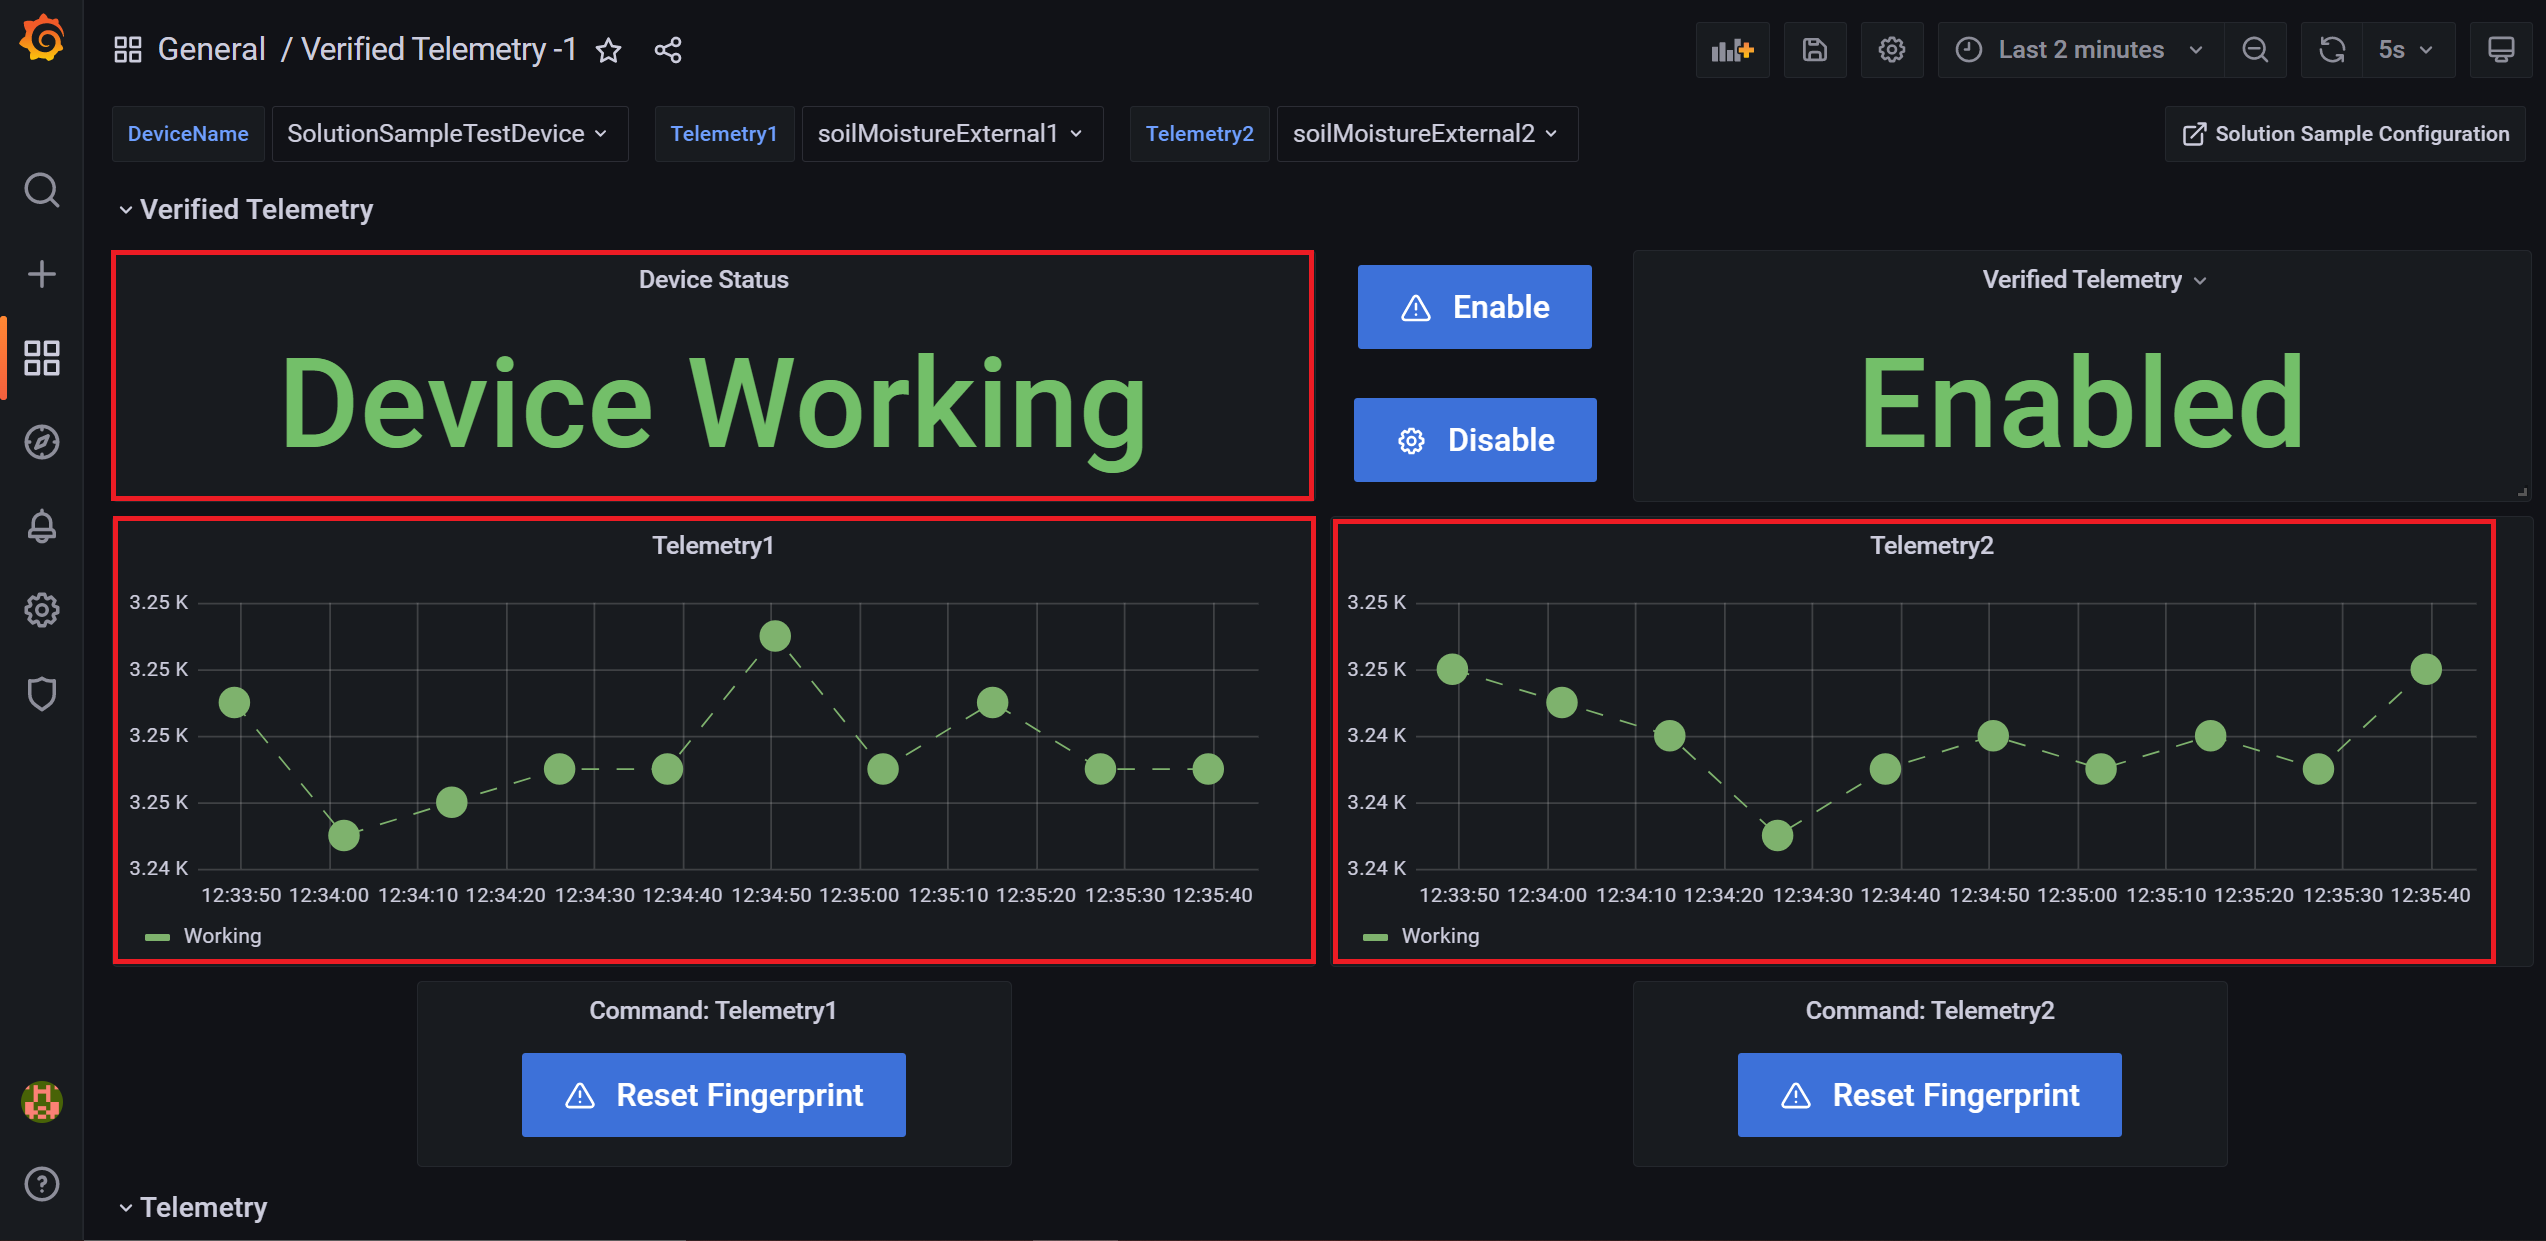
Verified Telemetry Dashboard supports multiple telemetry streams. 2 sensors can be monitored at the same time, these can be selected using the drop-down menus at the top of the page labeled Telemetry1 and Telemetry2.
-
Select the telemetries configured with Verified Telemetry in the Device Sample from the drop-down menus, for example: Telemetry1 : soilMoistureExternal1 or Telemetry2 : PMSExternal1. The graph and command button changes automatically to work with the sensors selected in the drop-down menu.
Enable Verified Telemetry
-
By default, Verified Telemetry is enabled and the status is shown on the right-hand side of the dashboard as seen in the image below.
-
If the status is disabled, Please click the
Enablebutton to turn ON Verified Telemetry.
Collect Fingerprint Template for Soil Moisture 1 telemetry
-
In order to get VT status for Soil Moisture 1 telemetry, we should collect a fingerprint template (ideally once).
-
To collect the fingerprint template for the attached sensor 'Soil Moisture 1' telemetry, issue command
Set/Reset Fingerprint TemplateNote: If the fingerprint template is not set for a device, VT status cannot be obtained and will result in unverified telemetry data shown in orange
Consuming Verified Telemetry Information
-
Now that for all the sensors, a working fingerprint template has been collected, we can now see both the device status and telemetry status.
-
The property
Device Statusindicates that all the telemetries supported by Verified Telemetry (i.e., Soil Moisture 1 and 2) are verified and the telemetry color GREEN indicates that both Soil Moisture 1 and Soil Moisture 2 telemetries are verified. -
To test whether the attached sensors are working as expected, hold the moisture sensor in your palm as shown below. Since these sensors are capacitive sensors, more the moisture lower is their output. We can see this expected decrease on the solution sample dashboard.
-
Simulate a faulty sensor:To simulate a faulty sensor, just disconnect Ground Pin (GND) on the Soil Moisture Sensor 1 which would create an Open Port fault!- We can see that the telemetry data still shows some data, which is typically garbage/dirty. Detecting such data as garbage/faulty is non-trivial and VT automatically detects the faulty sensor and changes the telemetry color to RED
- You can now connect back the Ground Pin to the sensor and see that telemetry color of 'Soil Moisture 1' sensor turning to GREEN immediately.
FAQ
-
Q: What happens if the device reboots after collection of Fingerprint Template?
- A: Our library stores the Verified Telemetry Fingerprint Templates in the Digital Twin. By fetching the Digital Twin after reboot, the device goes back to its original state that it was in before reboot. Thus, user collects the fingerprint template only once when the sensor is provisioned and working.
-
Q: What happens if Verified Telemetry is disabled by the property enableVerifiedTelemetry ?
-
Q: Does the solution sample display Telemetries which are not supported by Verified Telemetry feature?
-
Q: Can the solution be reconfigured to read and interact with a new device which might be connected to a different IoT Hub?
-
A: Yes! Open your browser and navigate to below URL
Submitting this form with new and valid details will re-configure the solution sample to read and interact with a new device
-
Next Steps
- With this sample, you have now setup a Verified Telemetry Custom Solution Sample and interacted with a Verified Telemetry Device Sample


