Microhack 1 README Revamp |
||
|---|---|---|
| assets/images | ||
| CODE_OF_CONDUCT.md | ||
| LICENSE | ||
| README.md | ||
| SECURITY.md | ||
| SUPPORT.md | ||
README.md
Microhack 1: Cluster Creation and Data Ingestion
This Microhack is organized into the following 3 challenges:
- Challenge 1: Create an ADX Cluster
- Challenge 2: Create integration with Azure services (Event Hub and Storage Account)
- Challenge 3: Starting with the basics of KQL
Each challenge has a set of tasks that need to be completed in order to move on to the next challenge. It is advisable to complete the challenges and tasks in the prescribed order.
Earn a digital badge! In order to receive the ADX microhack digital badge, you will need to complete the challenges marked with 🎓. Please submit the KQL queries/commands of these challenges in the following link: Answer sheet - ADX Microhack 1
Challenge 1: Create an ADX Cluster
To use Azure Data Explorer (ADX), you first have to create an ADX cluster, and create one or more databases in that cluster. Each database has tables. Then you can ingest data into a table so that you can run queries against it.
In this challenge, you will design an ADX based architecture, create an ADX cluster and database.
In addition, you will get familiar with the Azure Data Explorer Web UI (Kusto Web Explorer).
Expected Learning Outcomes
- Deploy ADX cluster from Azure Portal
- Use ADX clients such as Kusto Web Explorer and Kusto Explorer (optional)
- The initial configuration of the cluster at creation time
Task 1: Create an ADX cluster resource
Sign in to the Azure Portal, select the + Create a resource button in the upper-left corner of the portal’s main page.
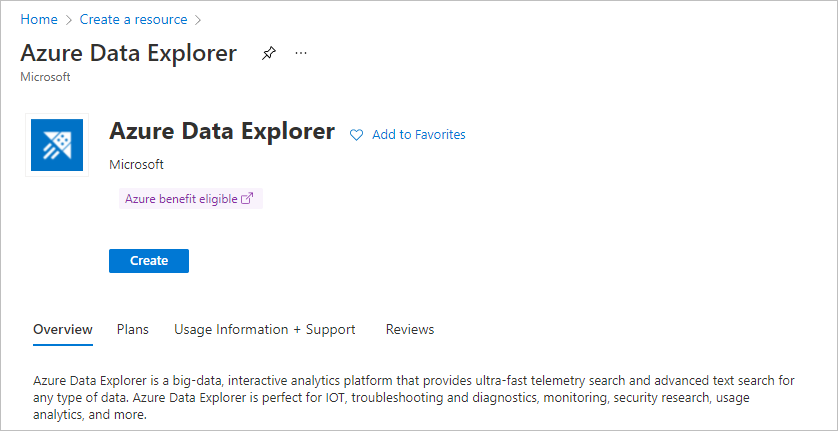
Search for Azure Data Explorer. Under Azure Data Explorer, select Create.
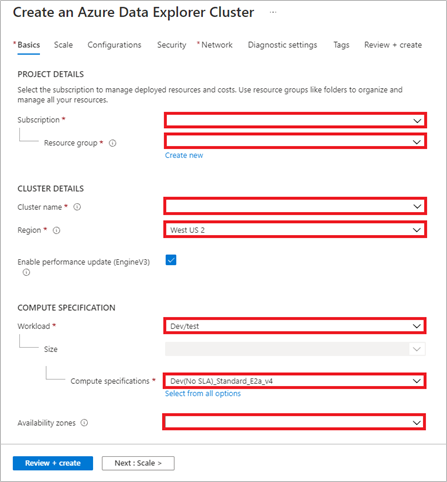
Fill out the basic cluster details with the following information.
-
Subscription: Use your own subscription
-
Resource Group: It's recommended to create a new resource group for the microhack's resources. Call it:
[youralias]-microhack-RG -
Cluster name: Must be unique for each participant. Call it:
[youralias]microhackadx(the cluster name must begin with a letter and contain lowercase alphanumeric characters) -
Region: Your preferred region (we chose
Australia East) -
Compute specification: For a production system, select the specification that best meets your needs (storage optimized or compute optimized). For this Microhack we can use the
Dev (No SLA) SKU.With various compute SKU options to choose from, you can optimize costs for the performance and hot-cache requirements for your scenario. If you need the most optimal performance for a high query volume, the ideal SKU should be compute-optimized. If you need to query large volumes of data with relatively lower query load, the storage-optimized SKU can help reduce costs and still provide excellent performance. You can read more about ADX’s SKU types here.
-
Availability zones: We can remove the 3 selected Availability zones for this Microhack.
-
Move to the next tab ("Scale"). Choose how to scale your resource. It’s always recommended to use "Optimized Autoscale" option. Optimized Autoscale is a built-in feature that helps clusters perform their best when demand changes. Optimized Autoscale enables your cluster to be performant and cost effective by adding and removing instances based on demand. For this microhack, since we will use
Dev/Test (no SLA) SKU, Optimized Autoscale option is disabled. Keep the default values (Minimum instance count == 1, Maximum instance count == 1)
You can keep all the other configurations with the default values. Select Review + create to review your cluster details. Then, select Create to provision the cluster. Provisioning typically takes about 10 minutes.
Creating an ADX cluster takes in average 10-15 minutes.
When the deployment is complete, select Go to resource. You will be redirected to the ADX cluster resource page. On the top of the Overview page, you can see the basic details of the cluster, like: the Subscription, the state (running) and the URI.
Task 2: Create a Database
You're now ready for the second step in the process: Database Creation.
-
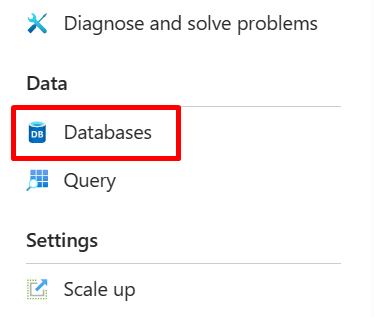
On the Overview tab, select Create database. Alternatively, you can go to the “Databases” blade.
-
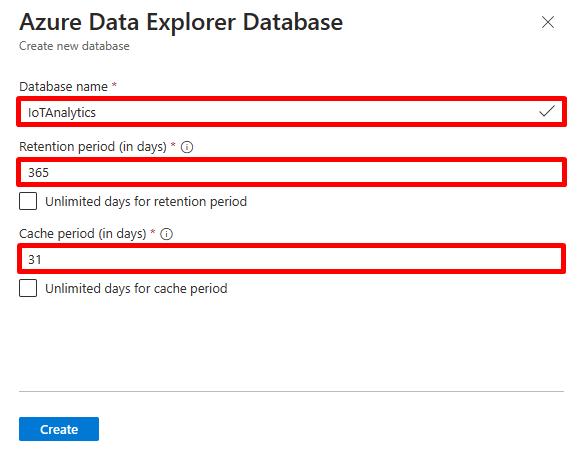
Fill out the form with the following information.
Setting Suggested Value Field Description Admin Default selected The admin field is disabled. New admins can be added after database creation. Database Name IoTAnalytics The database name must be unique within the cluster. Retention period 365 The time span (in days) for which it's guaranteed that the data is kept available to query. The time span is measured from the time that data is ingested. This is the longer-term storage (in reliable storage) retention. Cache period 31 The time span (in days) for which to keep frequently queried data available in SSD storage or RAM of the cluster’s VM, rather than in longer-term storage. Azure Data Explorer stores all its ingested data in reliable storage (most commonly Azure Blob Storage), away from its actual processing (such as Azure Compute) nodes. To speed up queries on that data, Azure Data Explorer caches it, or parts of it, on its processing nodes, SSD, or even in RAM. The best query performance is achieved when all ingested data is cached. Sometimes, certain data doesn't justify the cost of keeping it "warm" in local SSD storage. For example, many teams consider that rarely accessed older log records are of lesser importance. They prefer to have reduced performance when querying this data, rather than pay to keep it warm all the time. By increasing the cache policy, more VMs will be required to store data on their SSD/RAM. For Azure Data Explorer cluster, compute cost (VMs) is the most significant part of cluster cost as compared to storage and networking. -
Select Create to create the database. Creation typically takes less than a minute. When the process is complete, you're back on the cluster Overview blade. You can see the database that you have created from on the Databases blade.
Task 3: Write your first Kusto Query Language (KQL) query
What is a Kusto query?
Azure Data Explorer provides a web experience that enables you to connect to your Azure Data Explorer clusters and write and run Kusto Query Language queries. The web experience is available in the Azure portal and as a stand-alone web application, the Azure Data Explorer Web UI, that we will use later.
A Kusto query is a read-only request to process data and return results. The request is stated in plain text that's easy to read. A Kusto query has one or more query statements and returns data in a tabular or graph format.
In the next challenges, we'll ingest data to the cluster, and then learn the most important concepts in KQL and write interesting queries. In this task, you will write a few basic queries to get an understanding of the environment.
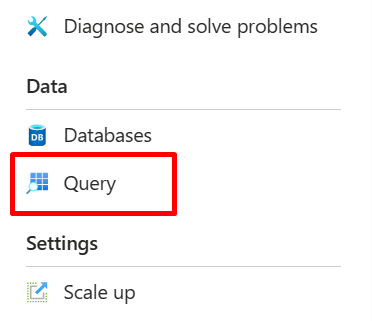
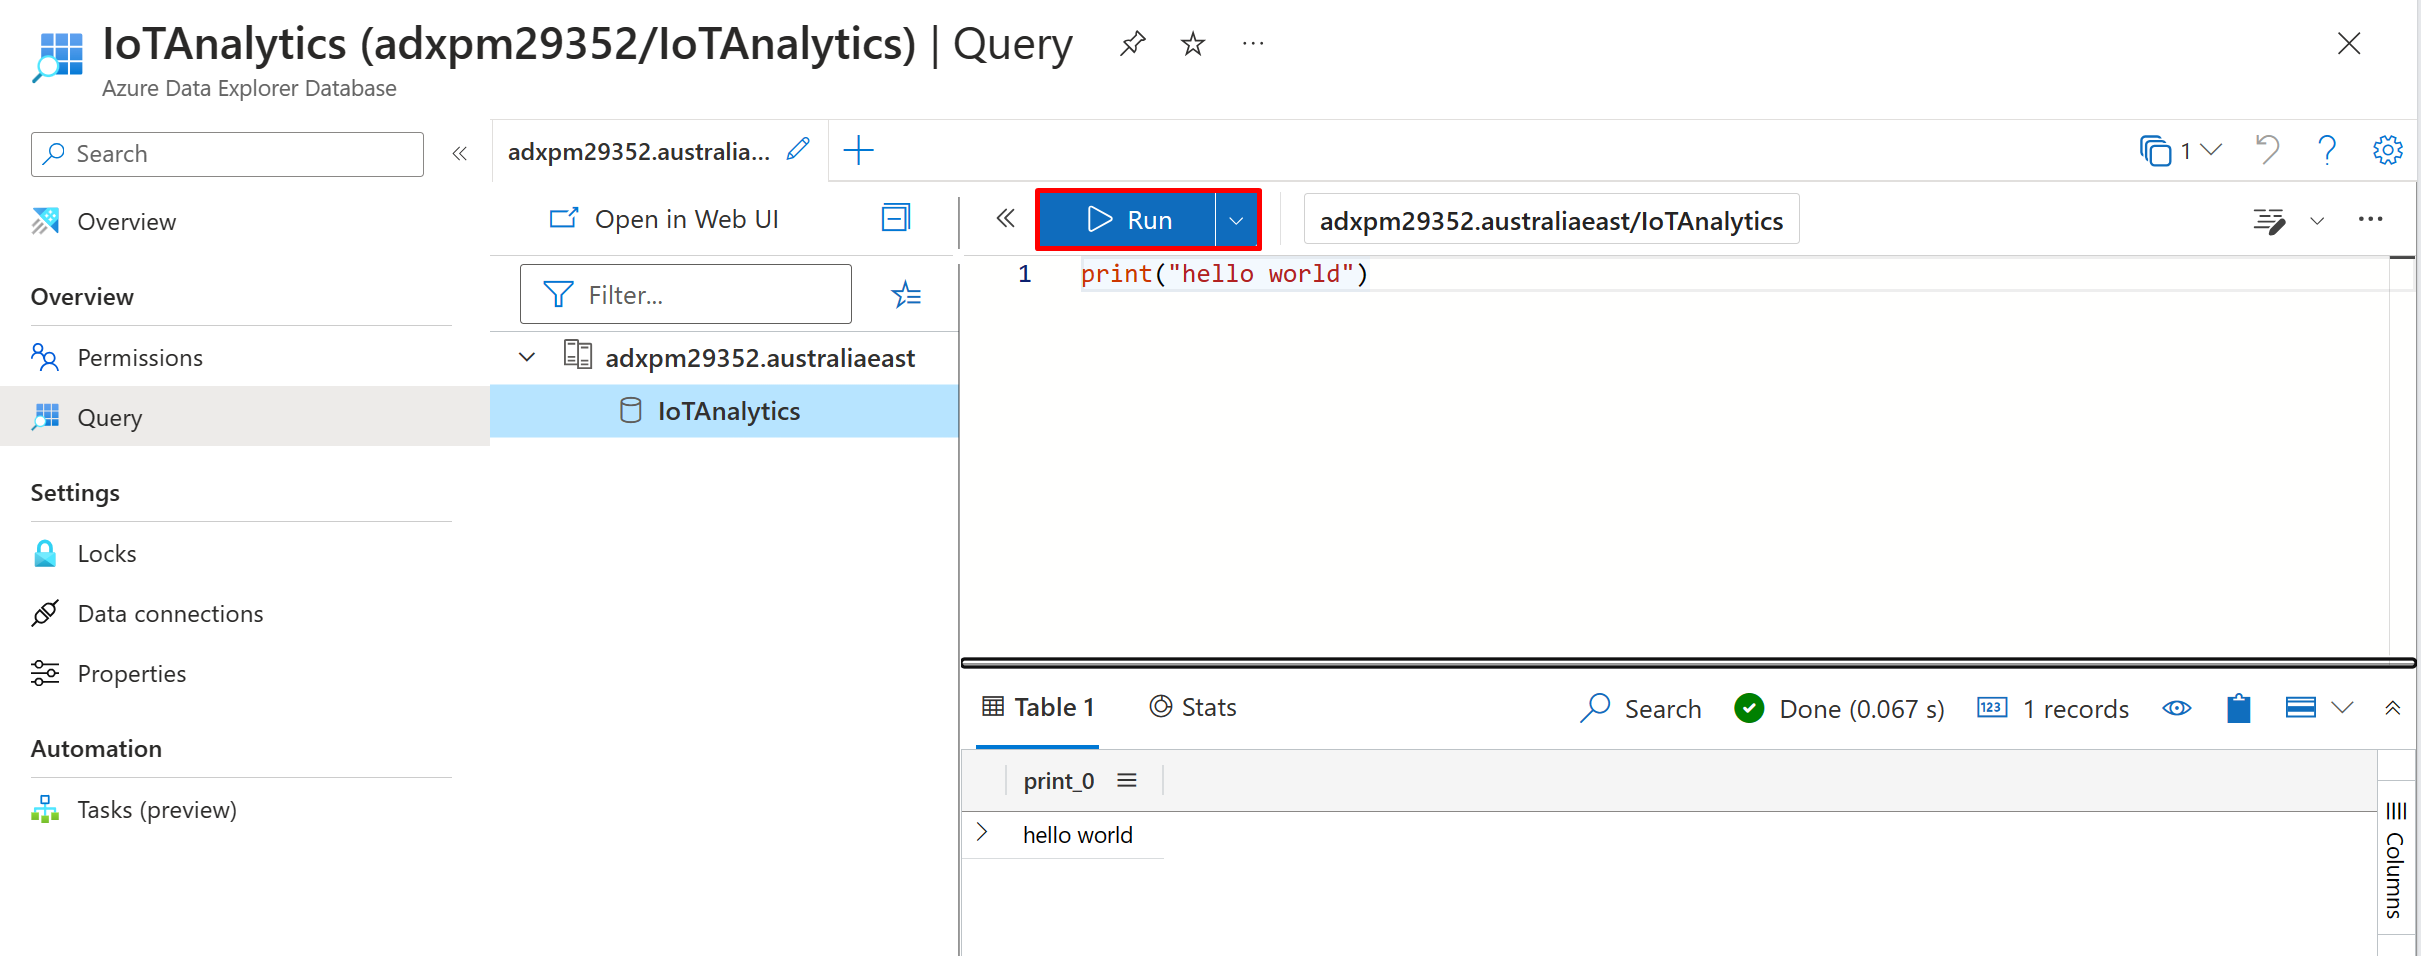
To start, go to the “Query” blade. In this example, you'll use the Azure Data Explorer web interface as a query editor (Kusto Query Language can also be used in Azure Monitor Logs, Azure Sentinel, and other services that are built on-top of Azure Data Explorer.)
We can see our cluster and the database that we created. To run KQL queries, you must select the database that the query will run on (the scope).
To select the database, just click on the database name.
Now - you can write a simple KQL query: print("hello world") and hit the Run button. The query will be executed and its result can be seen in the result grid on the bottom right of the page.
📝 Tip: Windows users can also download Kusto Explorer, a desktop client to run queries and benefit from advanced features available in the client.
Task 4: Enable Diagnostic Logs (optional)
Azure Monitor diagnostic logs provide monitoring data about the operation of Azure resources. ADX uses diagnostic logs for insights on ingestion, commands, queries, and tables usage. You can export operation logs to Azure Storage, Event Hub, or Log Analytics.
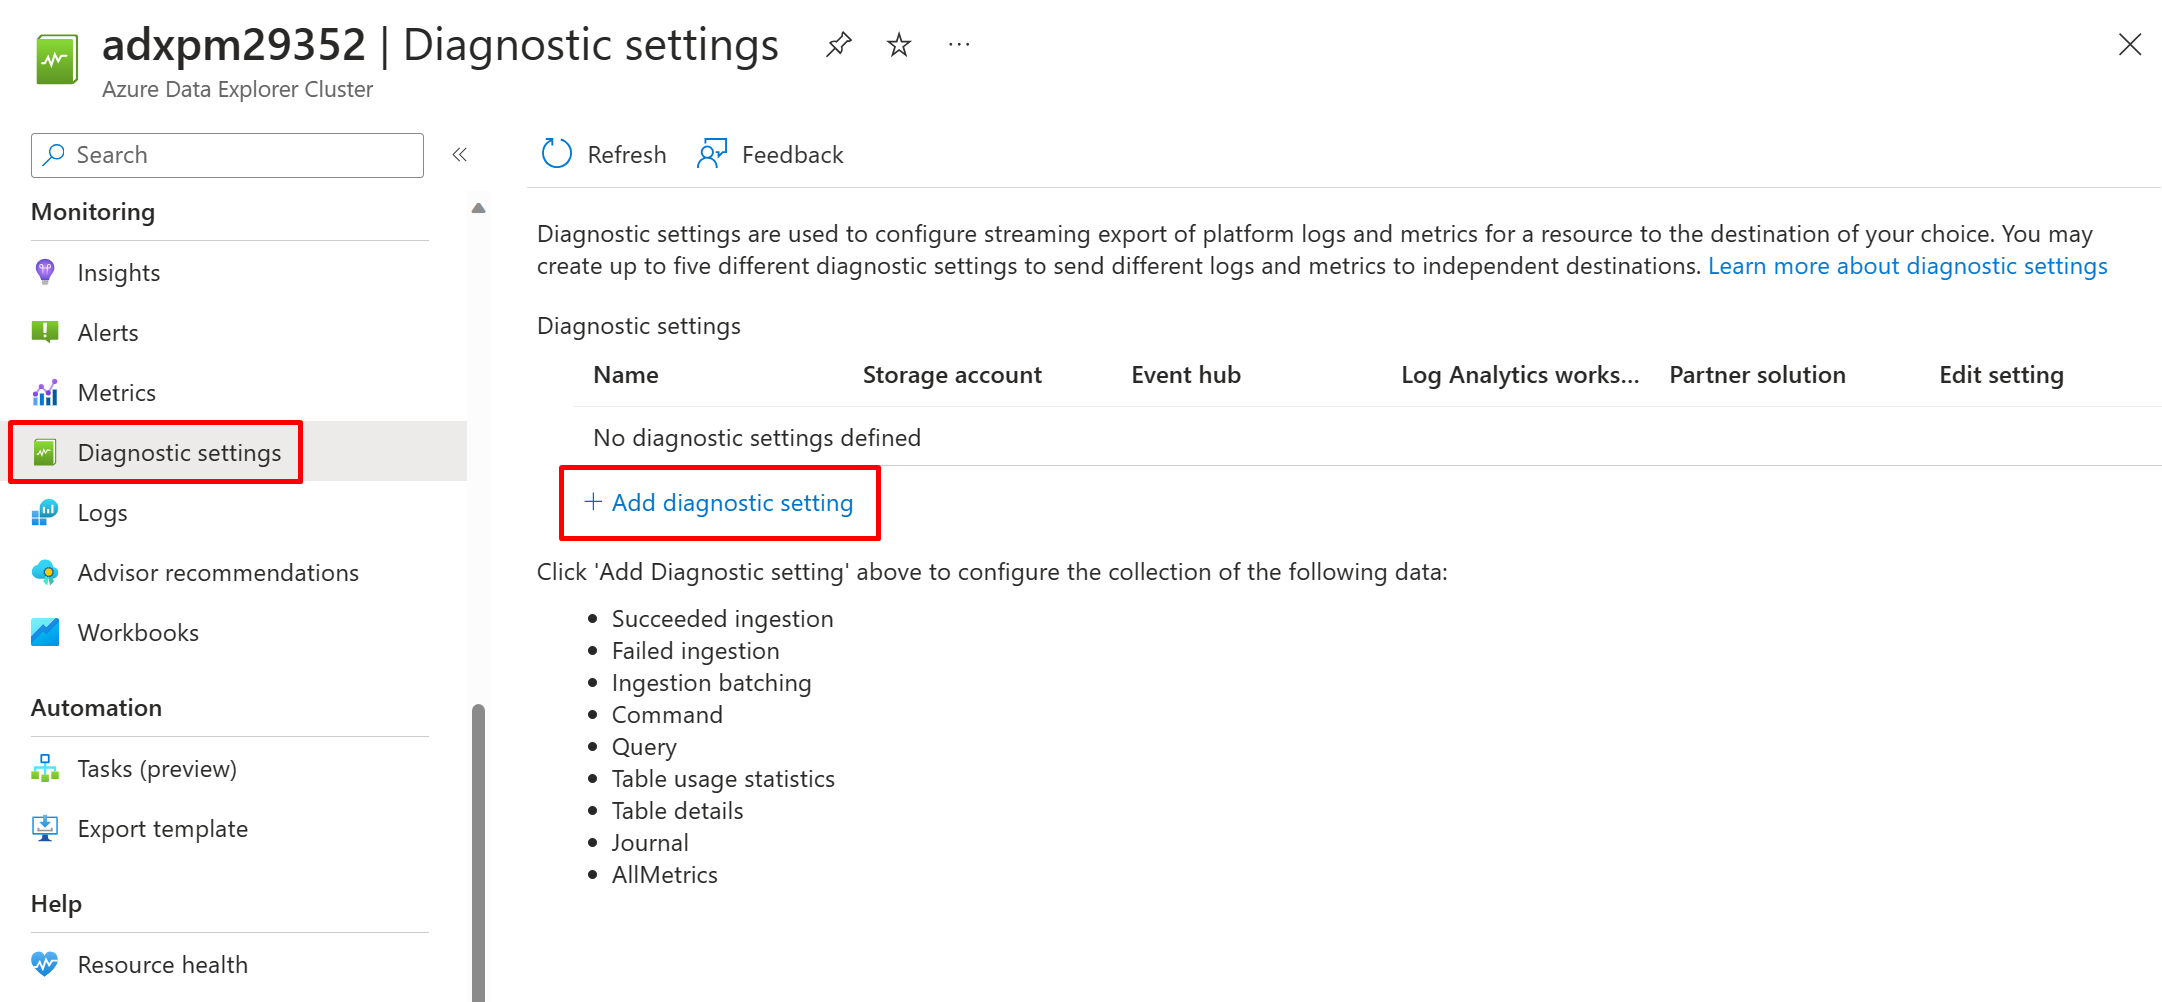
Diagnostic logs are disabled by default. To enable diagnostic logs, go to your cluster page in the portal. Under Monitoring, select Diagnostic settings.
Select Add diagnostic setting. In the Diagnostic settings window. Enter a Diagnostic setting name as per your preference.
Select all the log categories and metrics (SucceededIngestion, FailedIngestion, IngestionBatching, Command, or Query, TableUsageStatistics, TableDetails and Journal).
For this microhack, select the Destination details to be a Log Analytics workspace, then select your own workspace or create a new one.
Save the new diagnostic logs settings and metrics.
Challenge 2: Create integration with Azure services (Event Hub and Storage Account)
Data ingestion to ADX is the process used to load data records from one or more sources into a table in your ADX cluster. Once ingested, the data becomes available to query.
ADX supports several ingestion methods. These methods include ingestion tools, connectors and plugins, managed pipelines, programmatic ingestion using SDKs, and direct access to ingestion.
Expected Learning Outcomes
- Create continuous ingestion from Azure Event Hub (a managed pipeline)
- Create one-time ingestion from Azure Blob Storage to your ADX cluster.
Task 1: Use the "One-click" UI (User Interface) to create a data connection to an Azure Event Hub
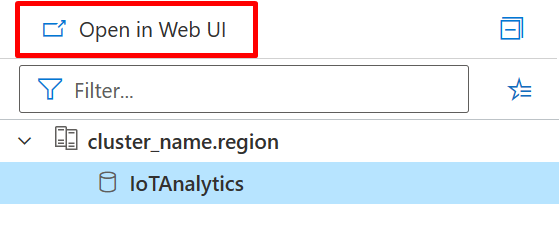
For the best user experience, we will use the Azure Data Explorer Web UI (aka: Kusto web Explorer/KWE). To open it, go to "Query" Pane and click on the “Open in Web UI” or just go to Kusto Web Explorer. The web UI opens.
For this Microhack, we use messages that are in JSON format and continuously sent to your Event Hub by an IoT Device. This is how a sample message looks like:
{
  "messageProperties": {
    "iothub-creation-time-utc": "2021-12-22T11:16:58.668Z"
  },
  "enrichments": {},
  "applicationId": "1b2f5f29-a78b-4012-bf31-2016473cadf6",
  "deviceId": "13n5b9yiael",
  "messageSource": "telemetry",
  "telemetry": {
    "Status": "Online",
    "BatteryLife": 52,
    "Light": 62602.66864777621,
    "Tilt": 44.70275959833819,
    "Shock": -6.381560743718394,
    "ActiveTags": 164,
    "Location": {
      "lon": -68.4585,
      "lat": 40.9633,
      "alt": 1069.4617
    },
    "TransportationMode": "Train",
    "LostTags": 5,
    "Temp": 13.178830710467722,
    "Humidity": 91.17280445807984,
    "Pressure": 1033.3527307505506,
    "TotalTags": 187
  },
  "schema": "default@v1",
  "enqueuedTime": "2021-12-22T11:16:58.753Z",
  "templateId": "dtmi:ltifbs50b:mecybcwqm"
}
KWE lets us easily connect to Azure Event Hub and build a table with its schema based on an event's data.
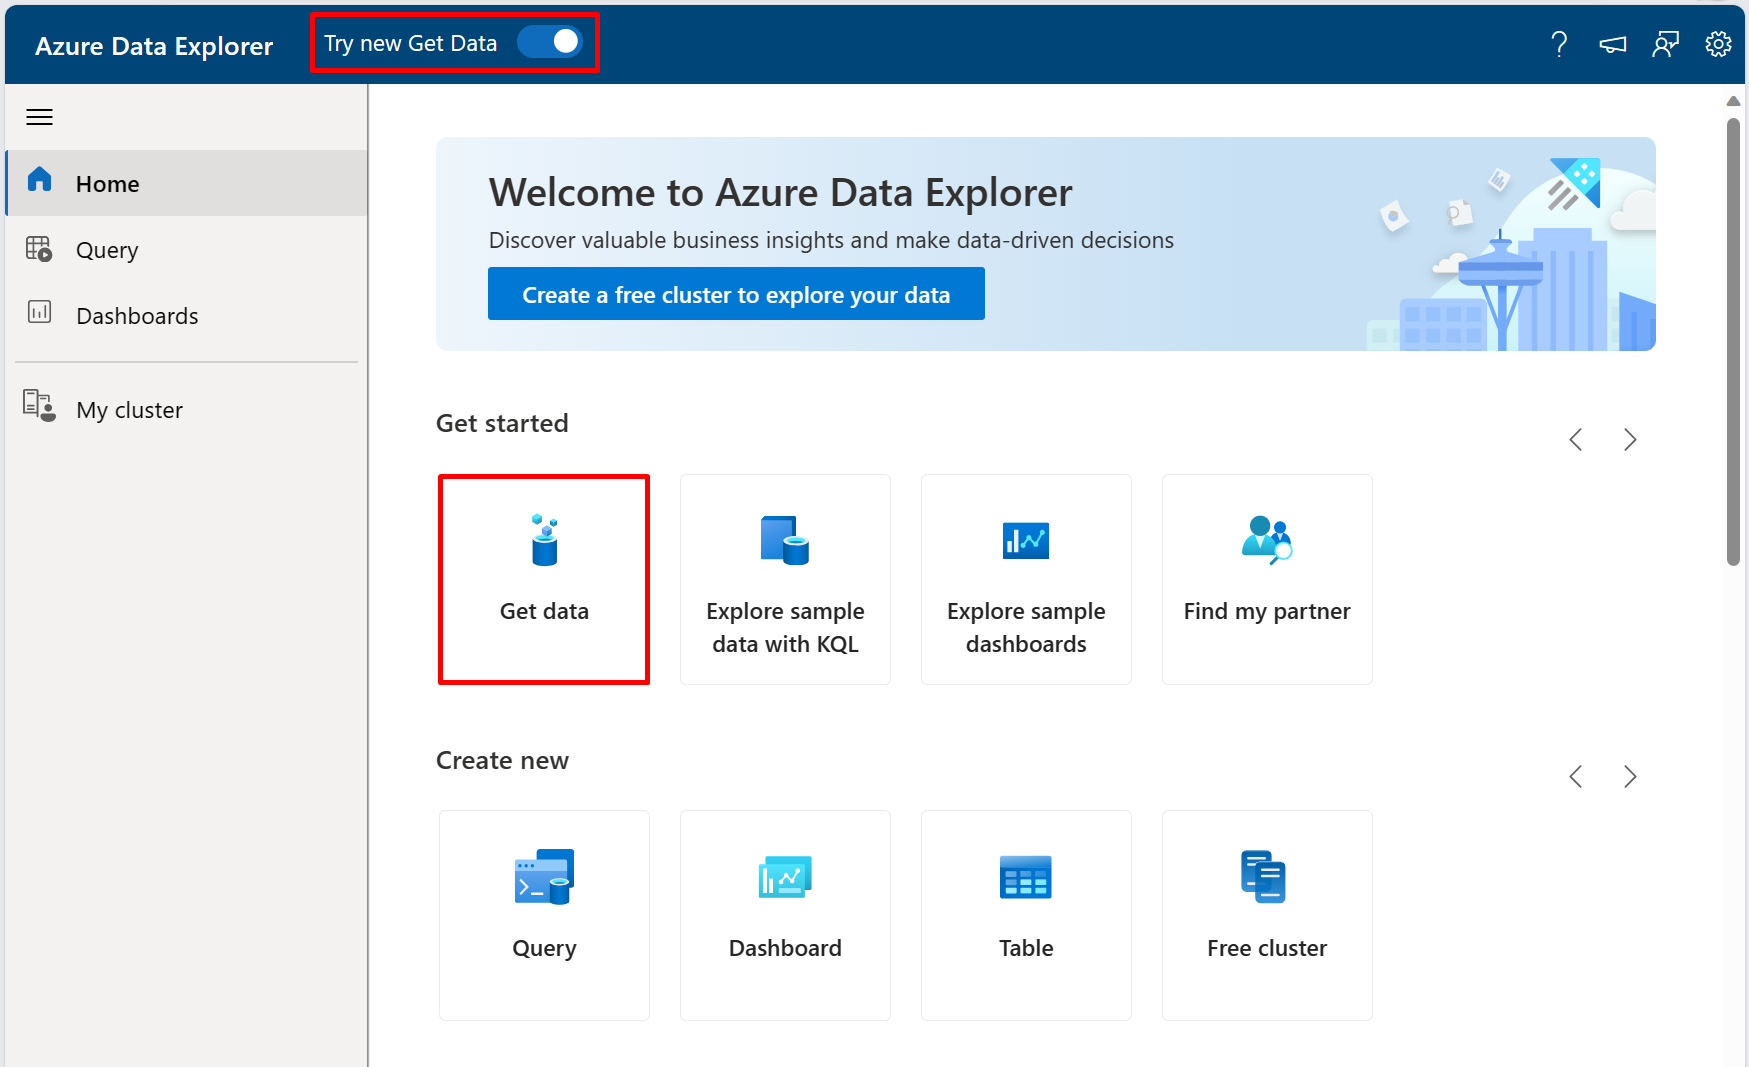
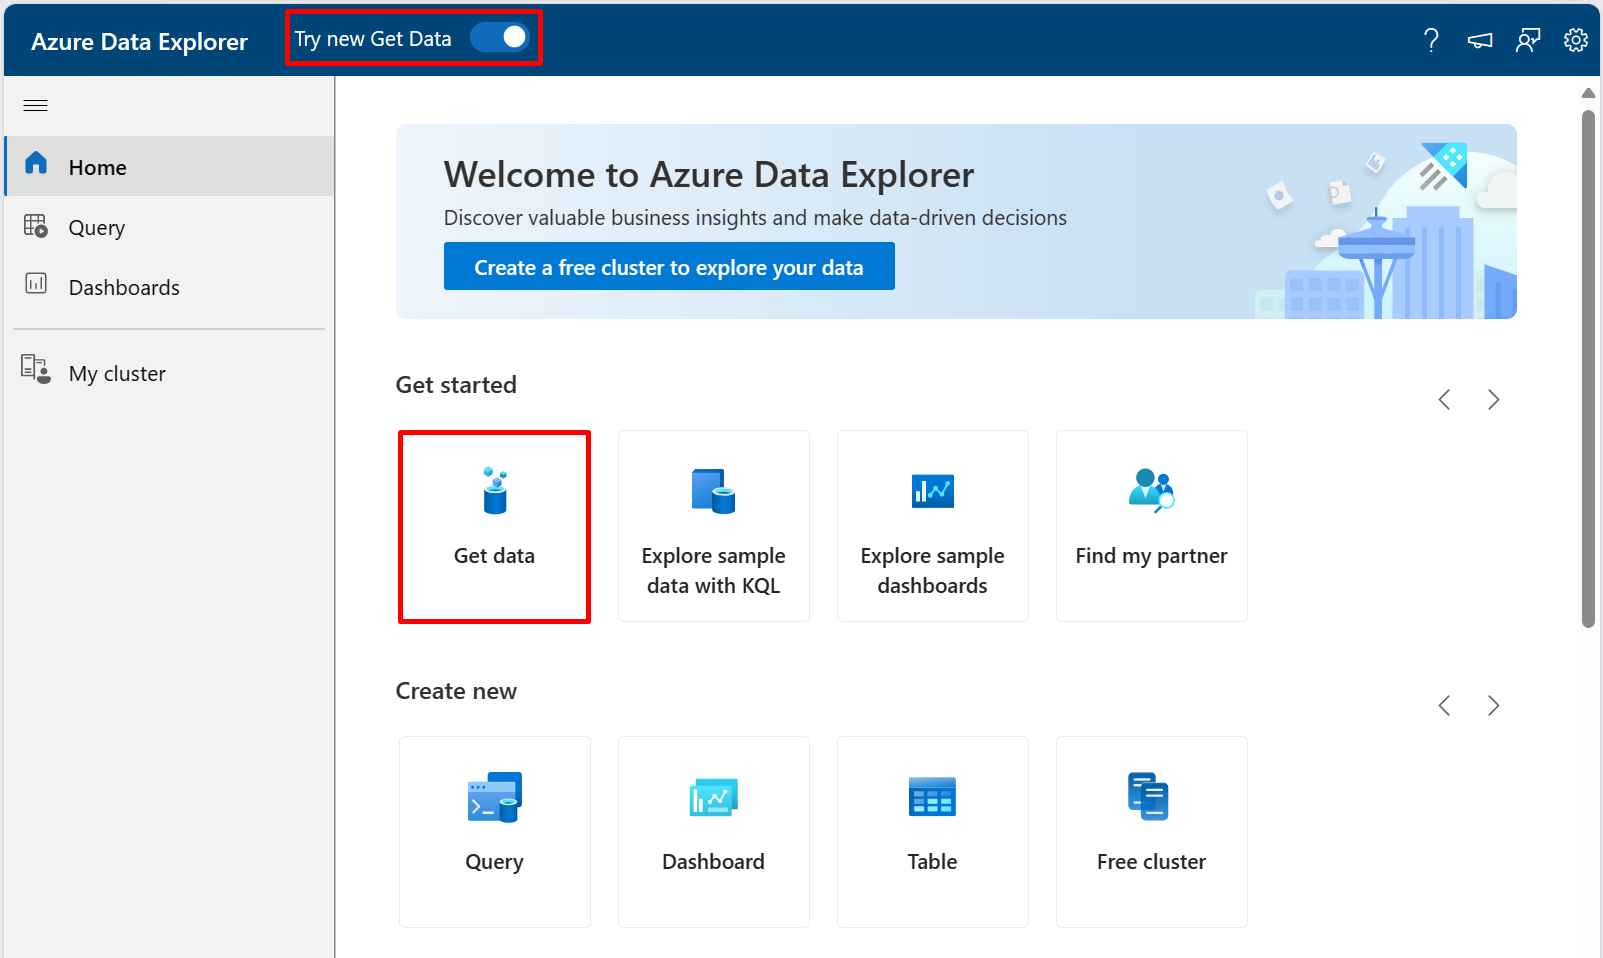
With the "Try new Get Data" layout enabled on the top menu bar, select the "Get data" segment to get started.
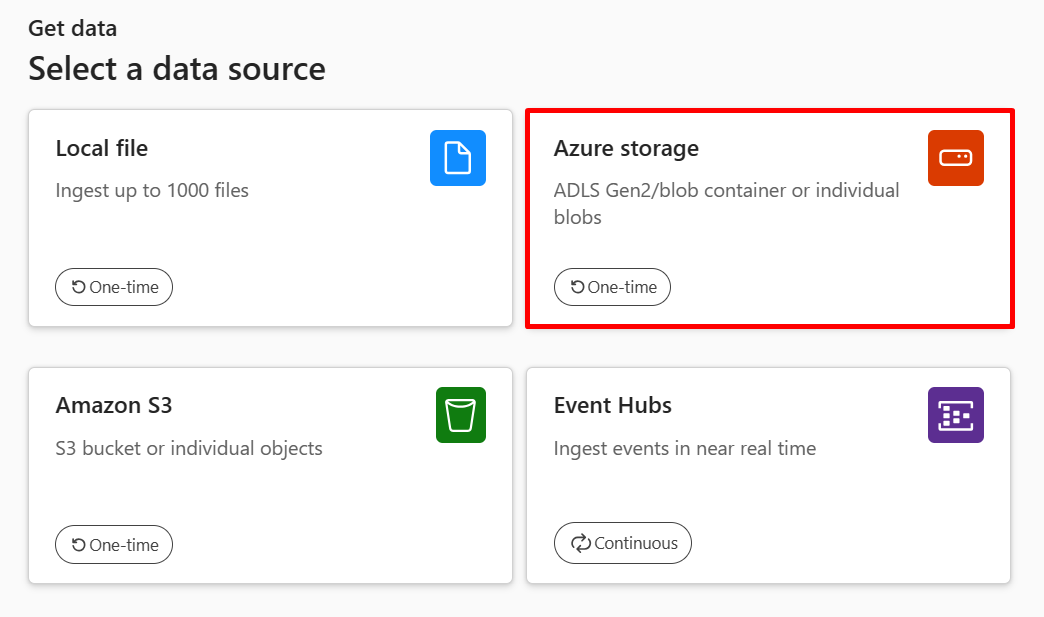
Now simply select the Event Hubs option to begin ingesting data continously from an Event Hub.
Task 2: Configure the Event Hub Data Connection
The 'Get data' wizard progresses to the next step.
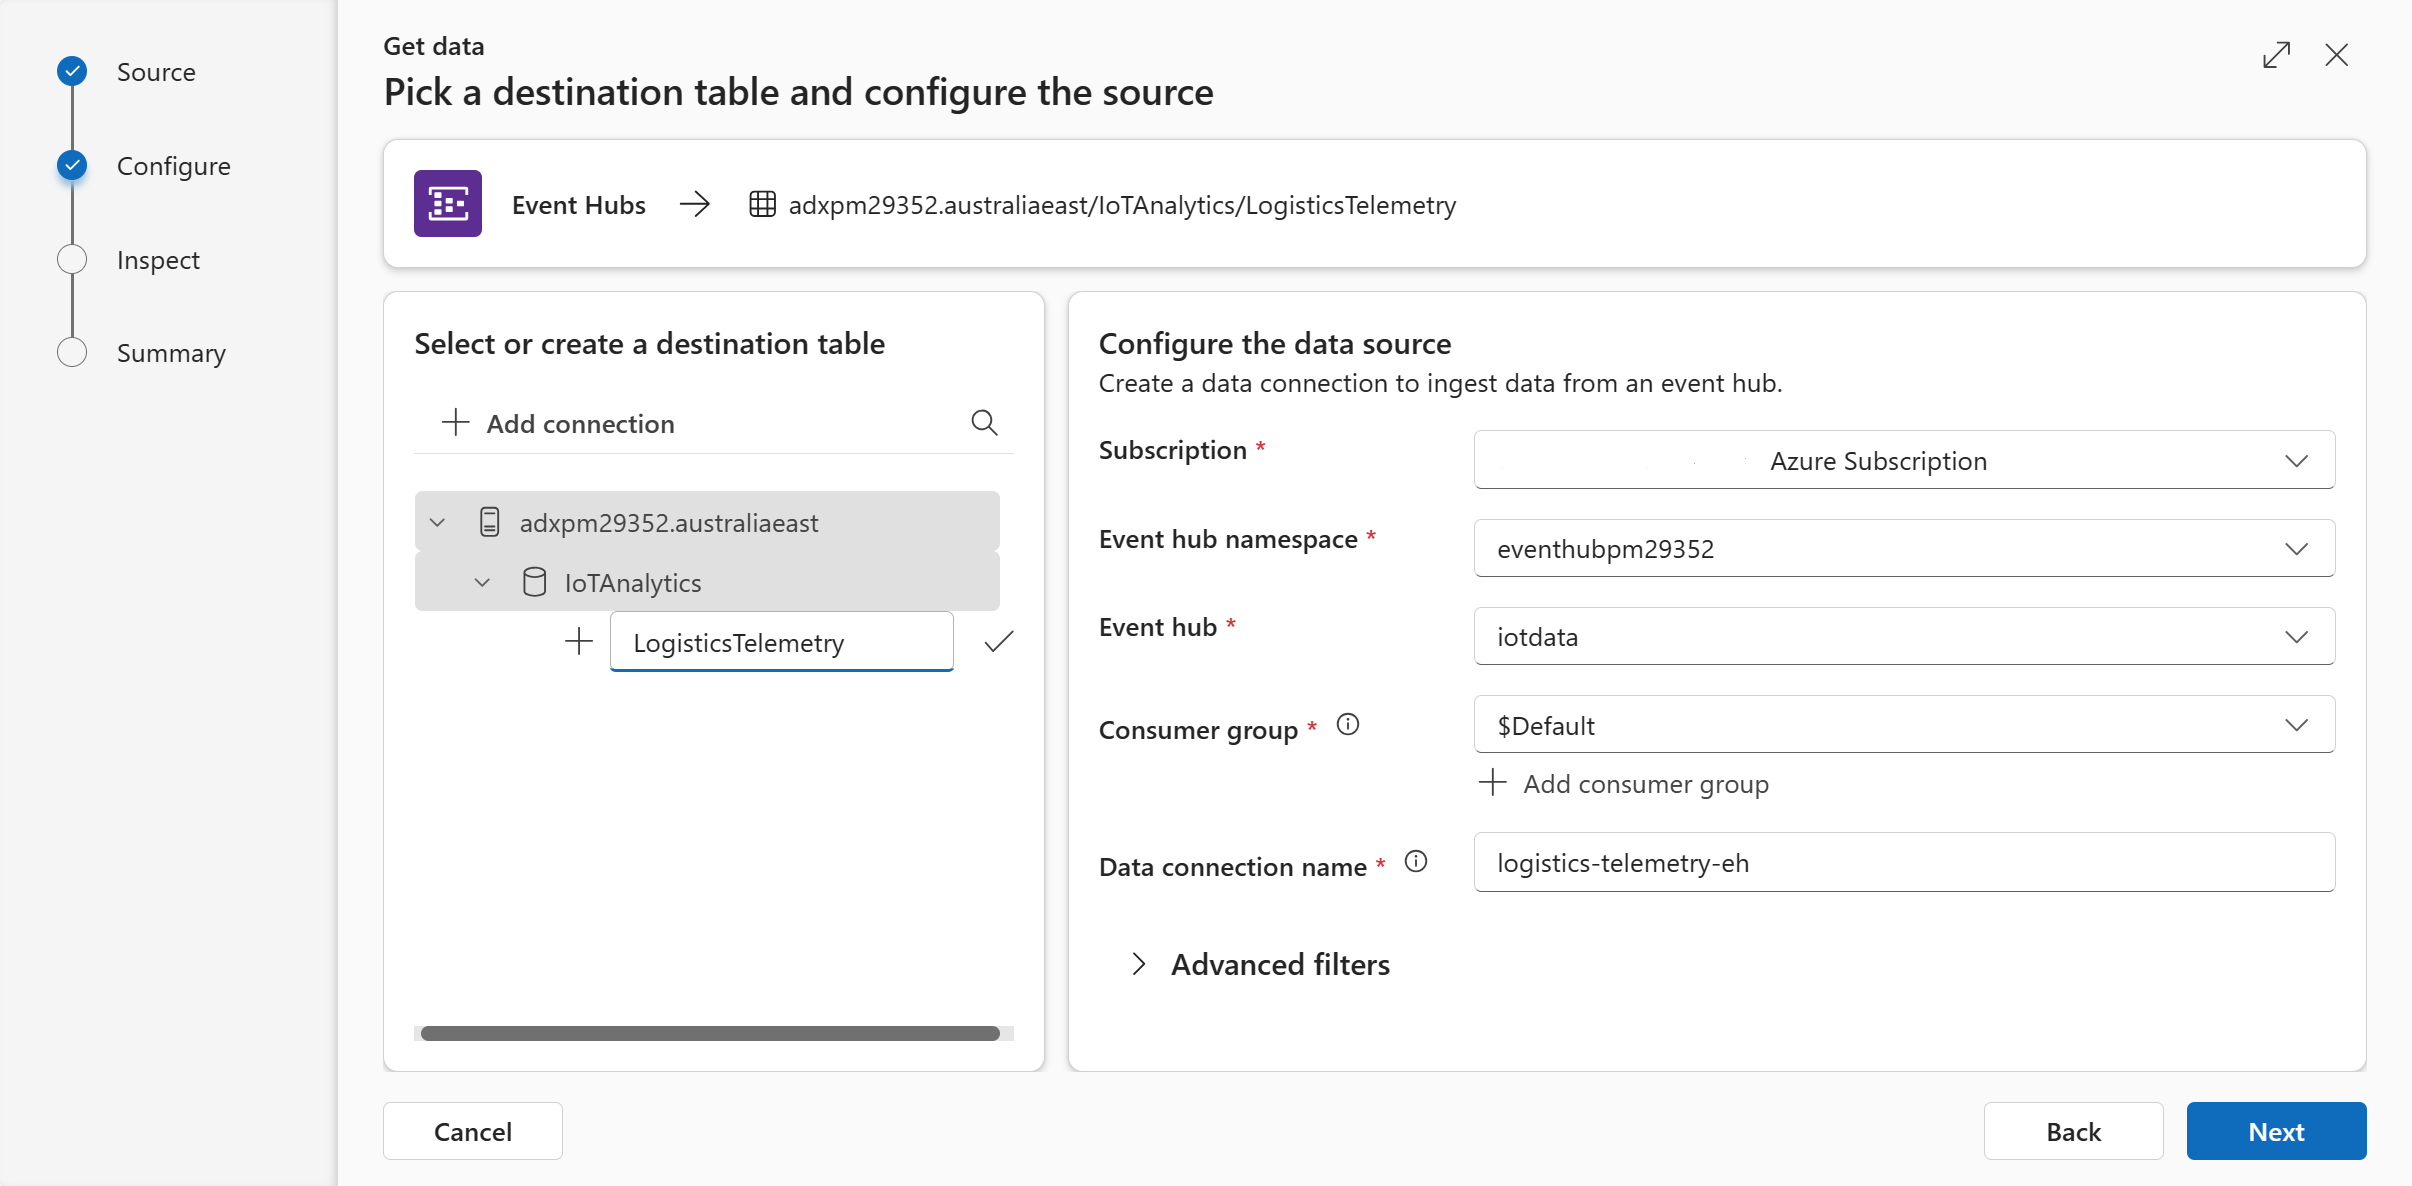
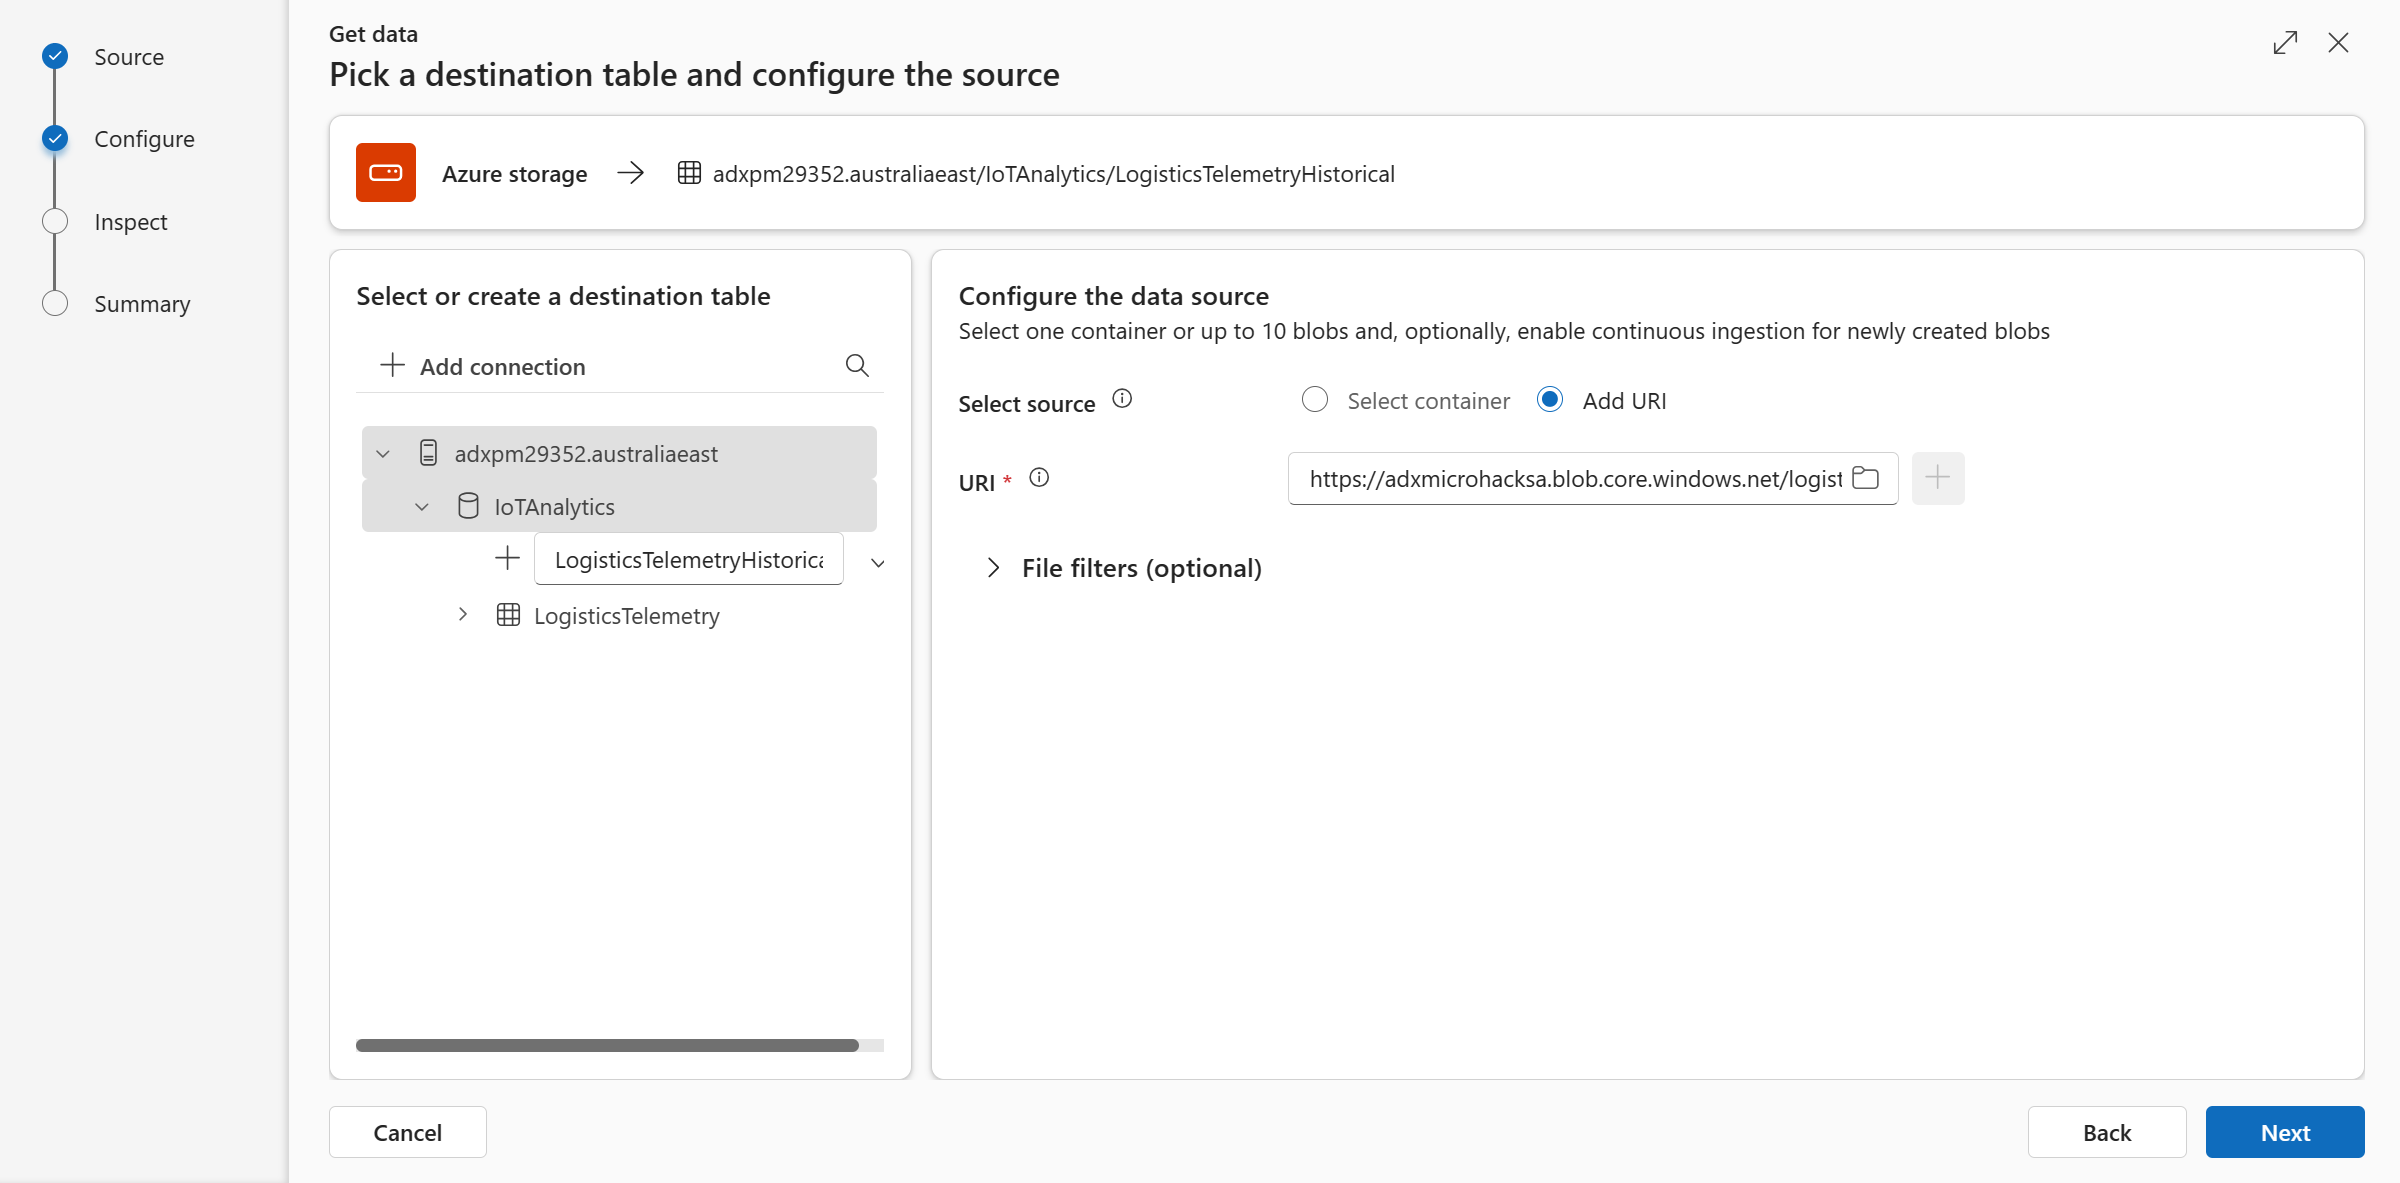
During the 'Configure' step, you will notice that the cluster and database fields are auto-populated. Select the ADX Cluster and the Database that you created in Challenge 1.
We haven't created a table yet, so use the "New table" option. In order to make it easier to query, we recommend using a table name without hyphens, '-'.
The table will be named: LogisticsTelemetry
In the Configure tab - specify the Event Hub details:
-
Subscription: Your Event Hub's subscription
-
Event Hub namespace: Your Event Hub's Namespace
-
Event Hub: Your Event Hub name
-
Data Connection Name: Set a name for your data connection. We used
logistics-telemetry-eh. A Data Connection connects the ADX database to Event Hub (or to Storage Account through Event Grid notifications) -
Consumer Group: You can use the default one
-
Compression: None
-
Event system properties: Leave empty. For this Microhack, we are not going to use them. System properties store properties (metadata) that are set by the Event Hub service at the time the event is enqueued. ADX can embed the selected properties into a new column in your destination table.
-
Event retrieval start data: Leave this empty too. For this Microhack, we are not going to use this feature. It allows you to specify the time from which to start ingesting data from the Event Hub.
Click on "Next"
In the Inspect tab:
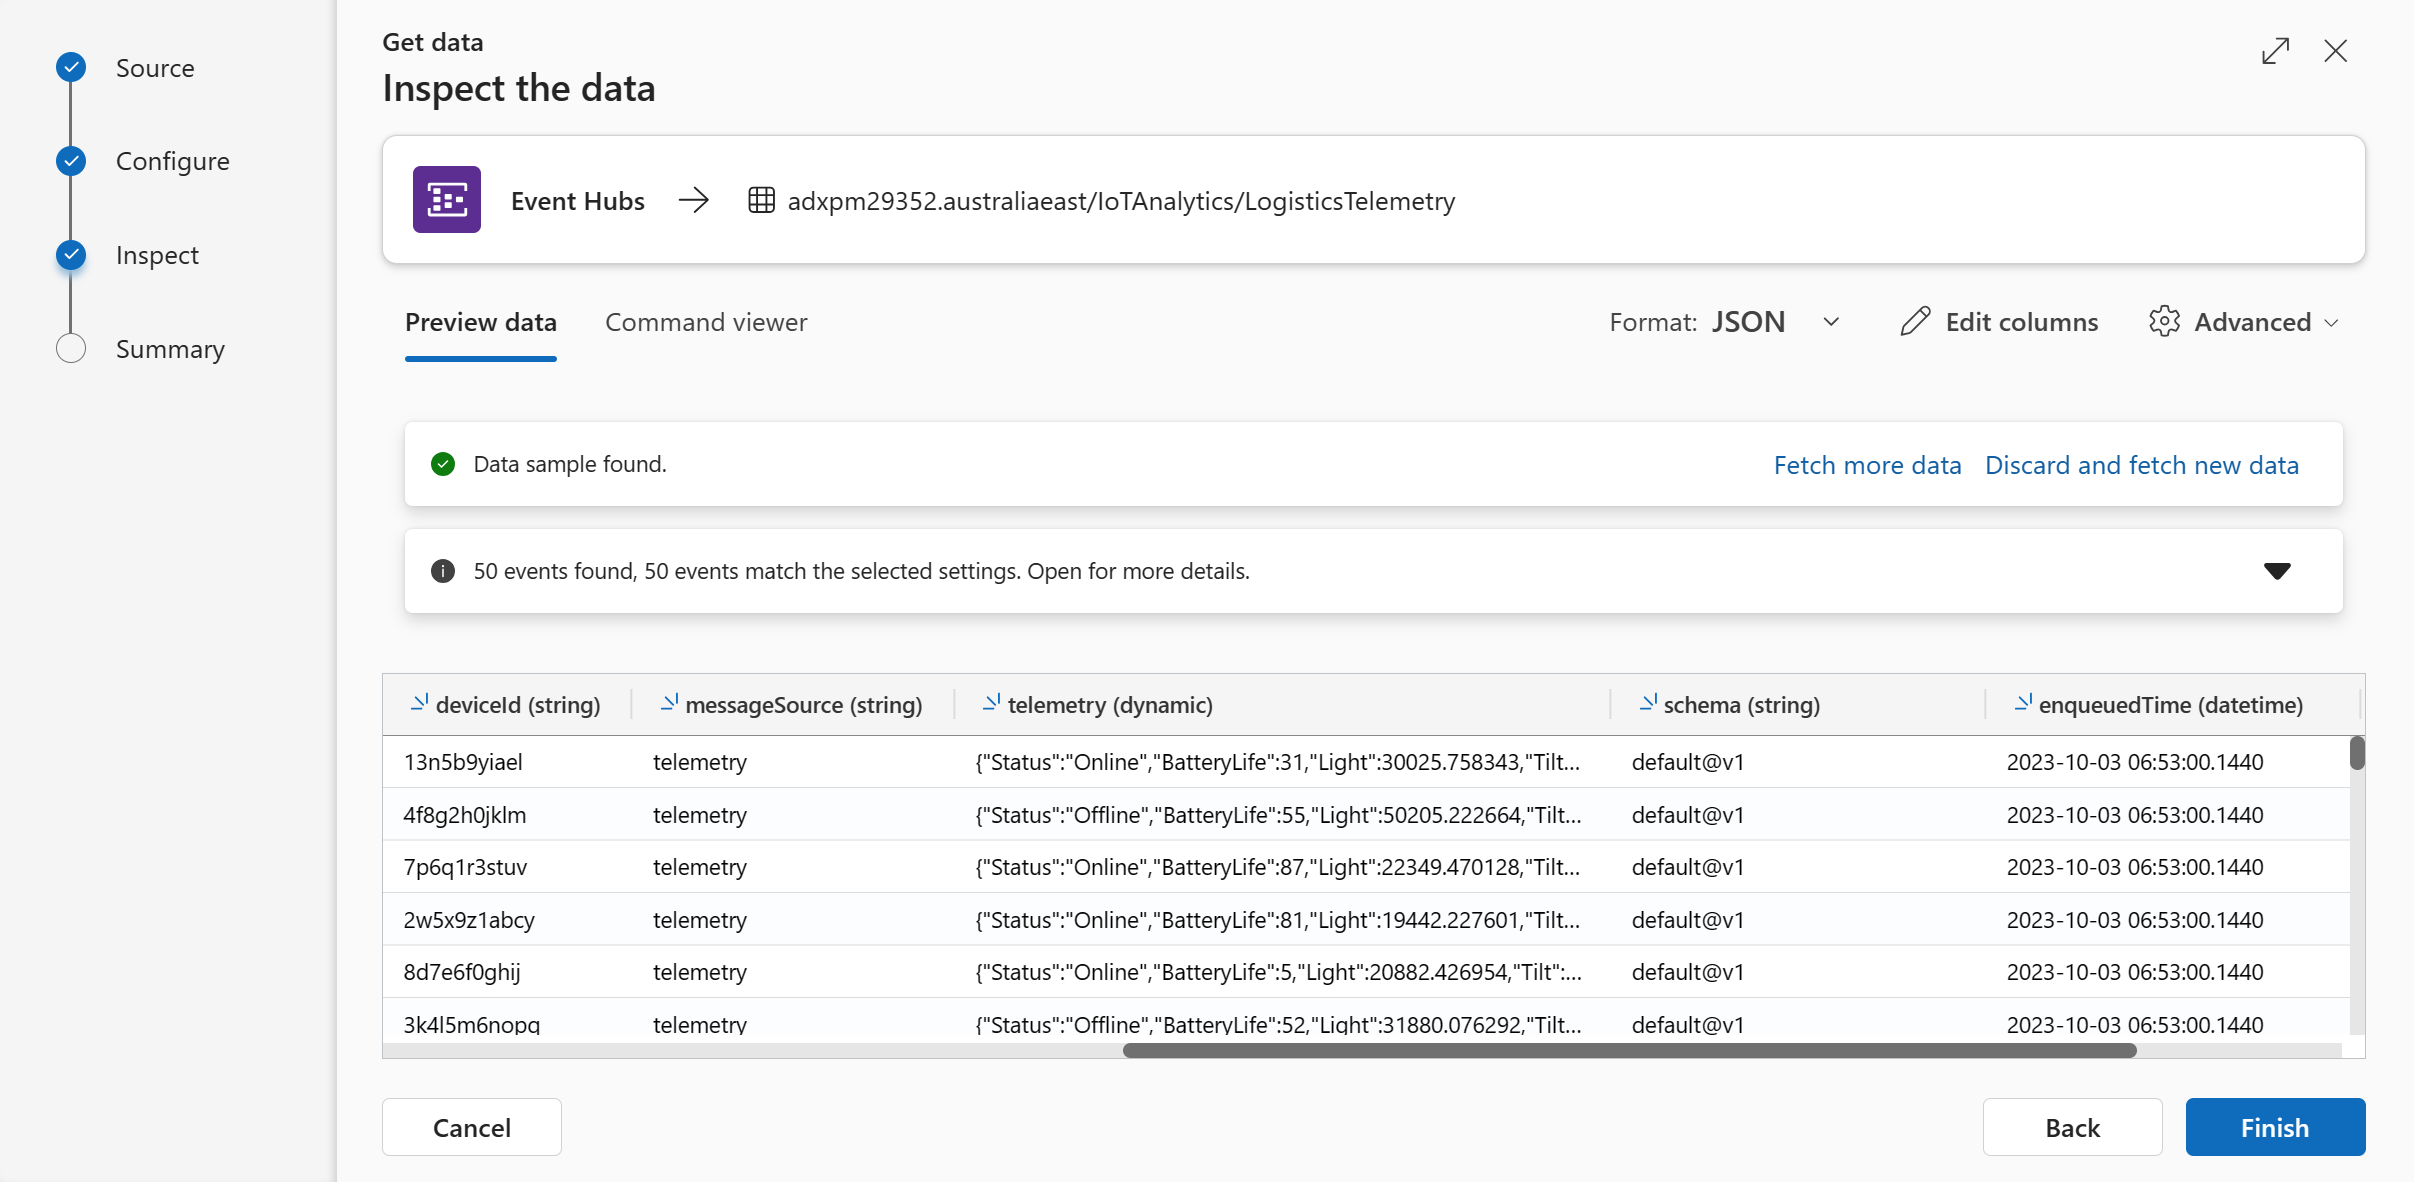
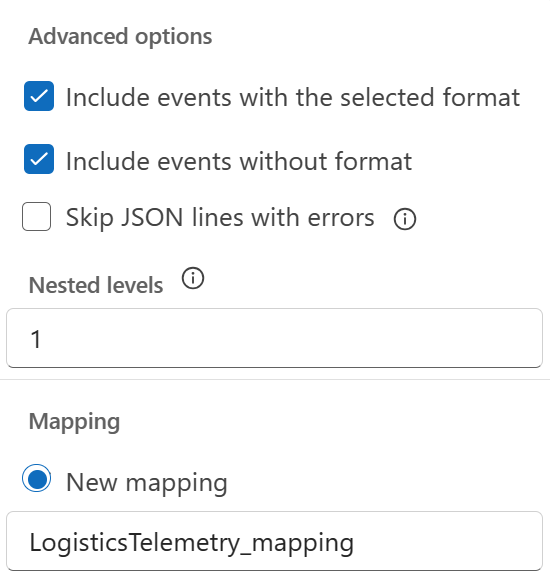
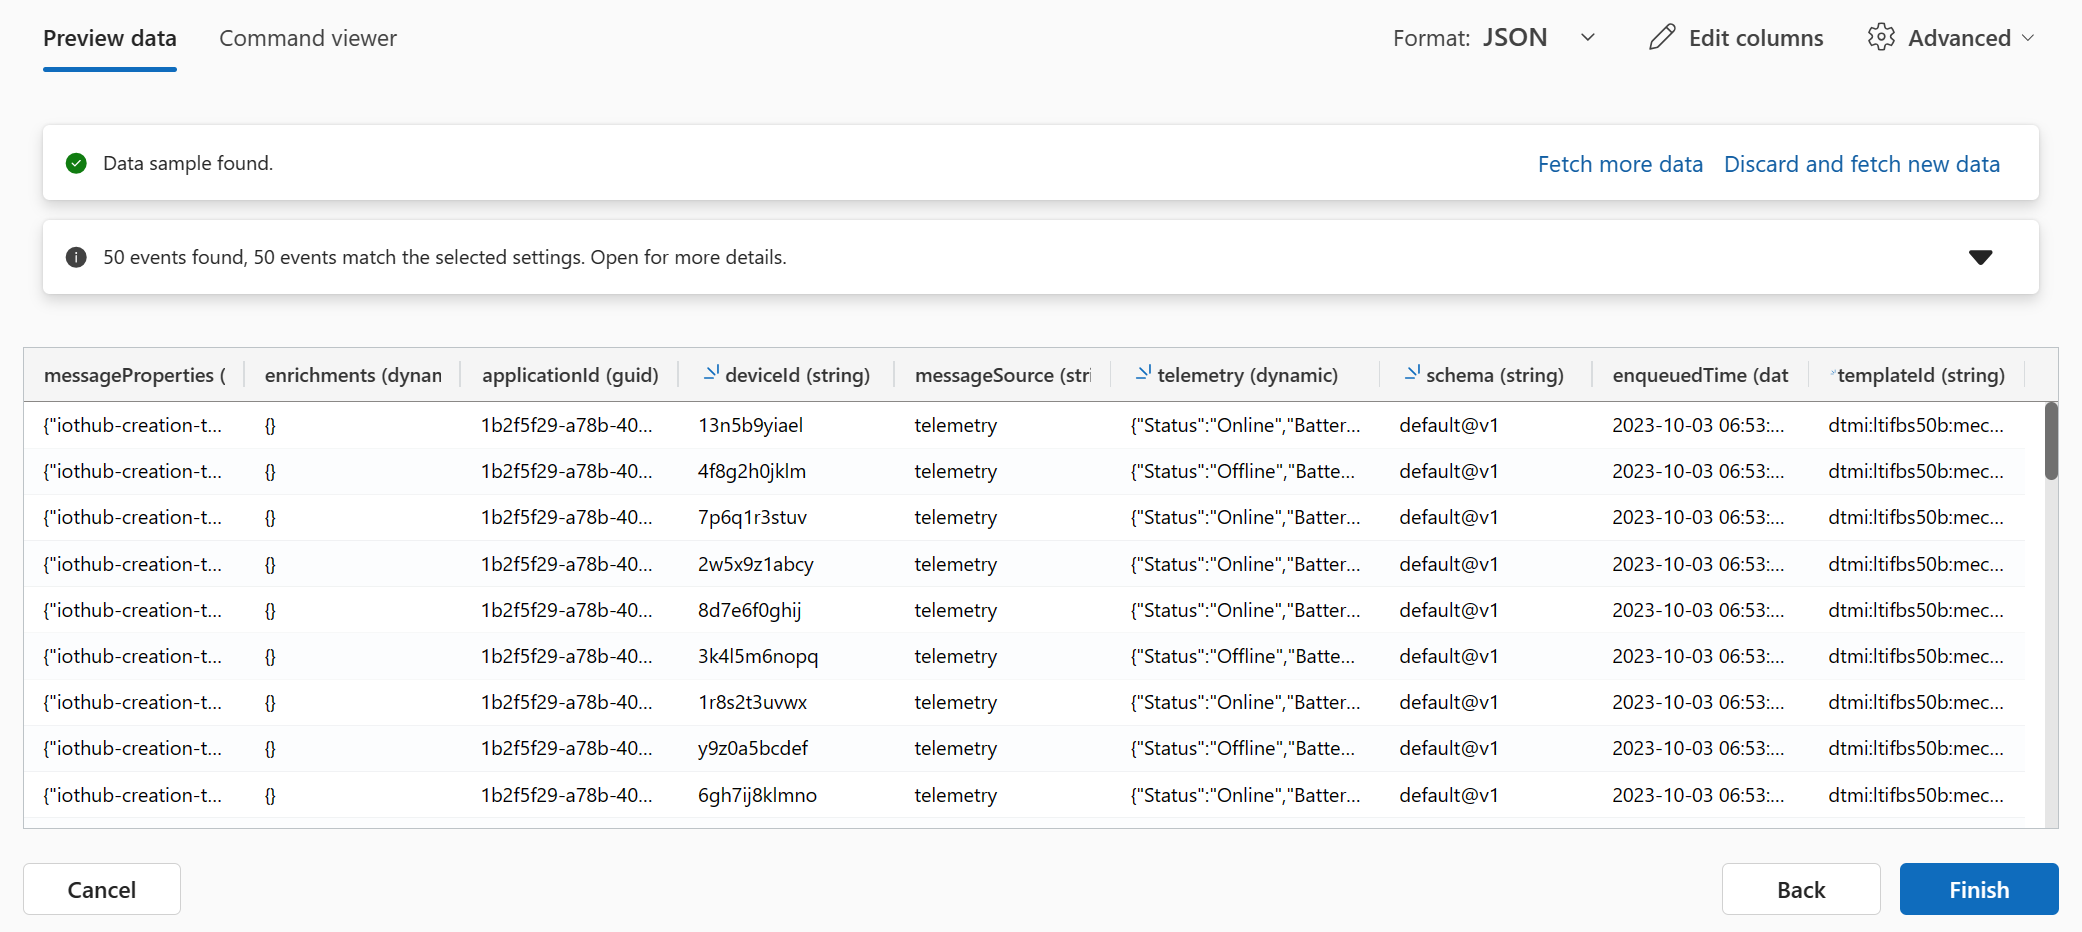
Sample data will be read from the Event Hub and you will see a data preview. The default format is TXT, but our Event Hub sends JSON data. Change the Data format field to JSON. Keep the nested levels as 1. As you can see, ADX inferred the column names and the data type according to the JSON’s data. Among the types you can find GUID, string, datetime, and dynamic.
You can think of dynamic column as a JSON-like type. The dynamic data type can take on any value of other scalar data types like:bool,datetime,guid,int,long,real,string,timespan, an array ofdynamicvalues, and a property bag (dictionary) that maps unique string values to dynamic values.
Although the dynamic type appears JSON-like, it can hold values that the JSON model does not represent because they don't exist in JSON (e.g.,long,real,datetime,timespan, andguid).
The 'Nested levels' field expands levels of nested data in dynamic type columns into separate columns. Although the raw event’s JSON format has a nestedness of 2 levels, for this microhack we will use 1 level and later see how to leverage the powerful update policy capability of ADX to break this payload into dynamic columns.
This is an example of the telemetry payload (which is part of a bigger JSON message that is being received by ADX from the Event Hub):
{
  "Location": { "alt": "252.71910000000003", "lon": -93.2176, "lat": 41.7911 },
  "LostTags": 4,
  "Light": "49115.368835522917",
  "Temp": "32.93780098864795",
  "TotalTags": 186,
  "Status": "Offline",
  "TransportationMode": "Land",
  "BatteryLife": -5,
  "Tilt": "-52.64112596209344",
  "Humidity": "74.018336518734131",
  "Shock": "6.696957328744805",
  "Pressure": "603.69265616418761",
  "ActiveTags": 170
}
If you set the Nested levels to 2, ADX will “break” the JSON to independent fields. This is useful to know, but in general IoT devices are subject to schema changes and if Contoso attaches additional sensors, the entire table schema may need to be updated. It could break existing queries and impact downstream consumers of this data.
For this microhack, we want to learn how ADX deals with dynamic fields, so we will keep the Nested levels as 1.
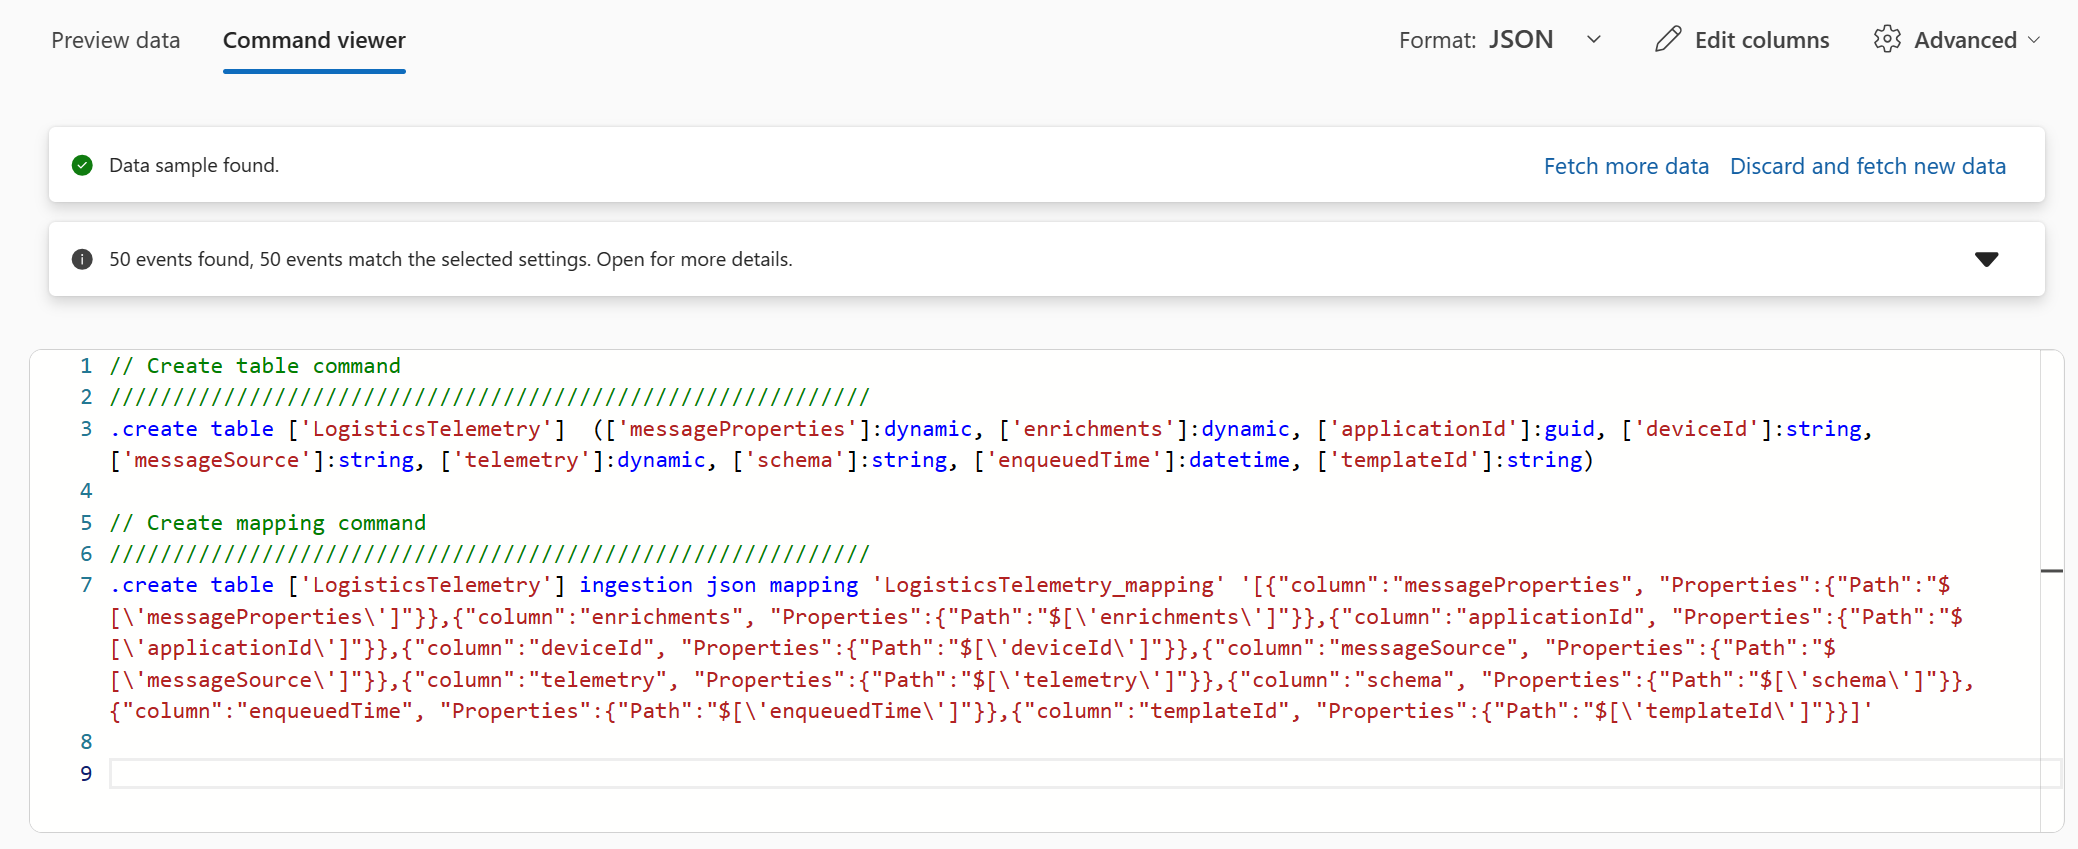
Open the command viewer. You can see the control commands that were automatically generated.
In contrast to Kusto queries, control commands are requests to Kusto to process or modify data or metadata. Control commands are distinguished from queries by having the first character in the text of the command be the dot (.) character (which can't start a query). Not all control commands modify data or metadata. The large class of commands that start with .show, are used to display metadata or data. For example, the .show tables command returns a list of all tables in the current database.
Review the control commands that were generated by One-Click.
You can see the:
.create table table_name command, which creates a new empty table.
.alter table table_name policy ingestionbatching, which alters the batching policy of the specified table. During the ingestion process, ADX optimizes for throughput by batching small ingress data chunks together before ingestion. Batching reduces the resources consumed by the ingestion process. The batching policy defines when to seal a batch and send it for the next stage of the ingestion (once the first condition is met):
| Parameter | Value | Description |
|---|---|---|
| Size | 1GB | Batch size limit reached or exceeded the configured size |
| Count | 1000 files | Batch file (blob) number limit reached the configured count |
| Time | 5 minutes | The configured batching time has expired (maximum delay time per batch) (One click sets the batching time to 30 seconds) |
The table mapping (data mapping) command: Data mappings are used during ingestion to map incoming data to columns inside tables. In our case, the incoming data arrives from the Event Hub in JSON format. The table mapping maps the JSON fields (by describing the path to elements in a JSON document) to our table’s columns.
The desired result:
Click on "Finish" to create this data connection and begin ingestion.
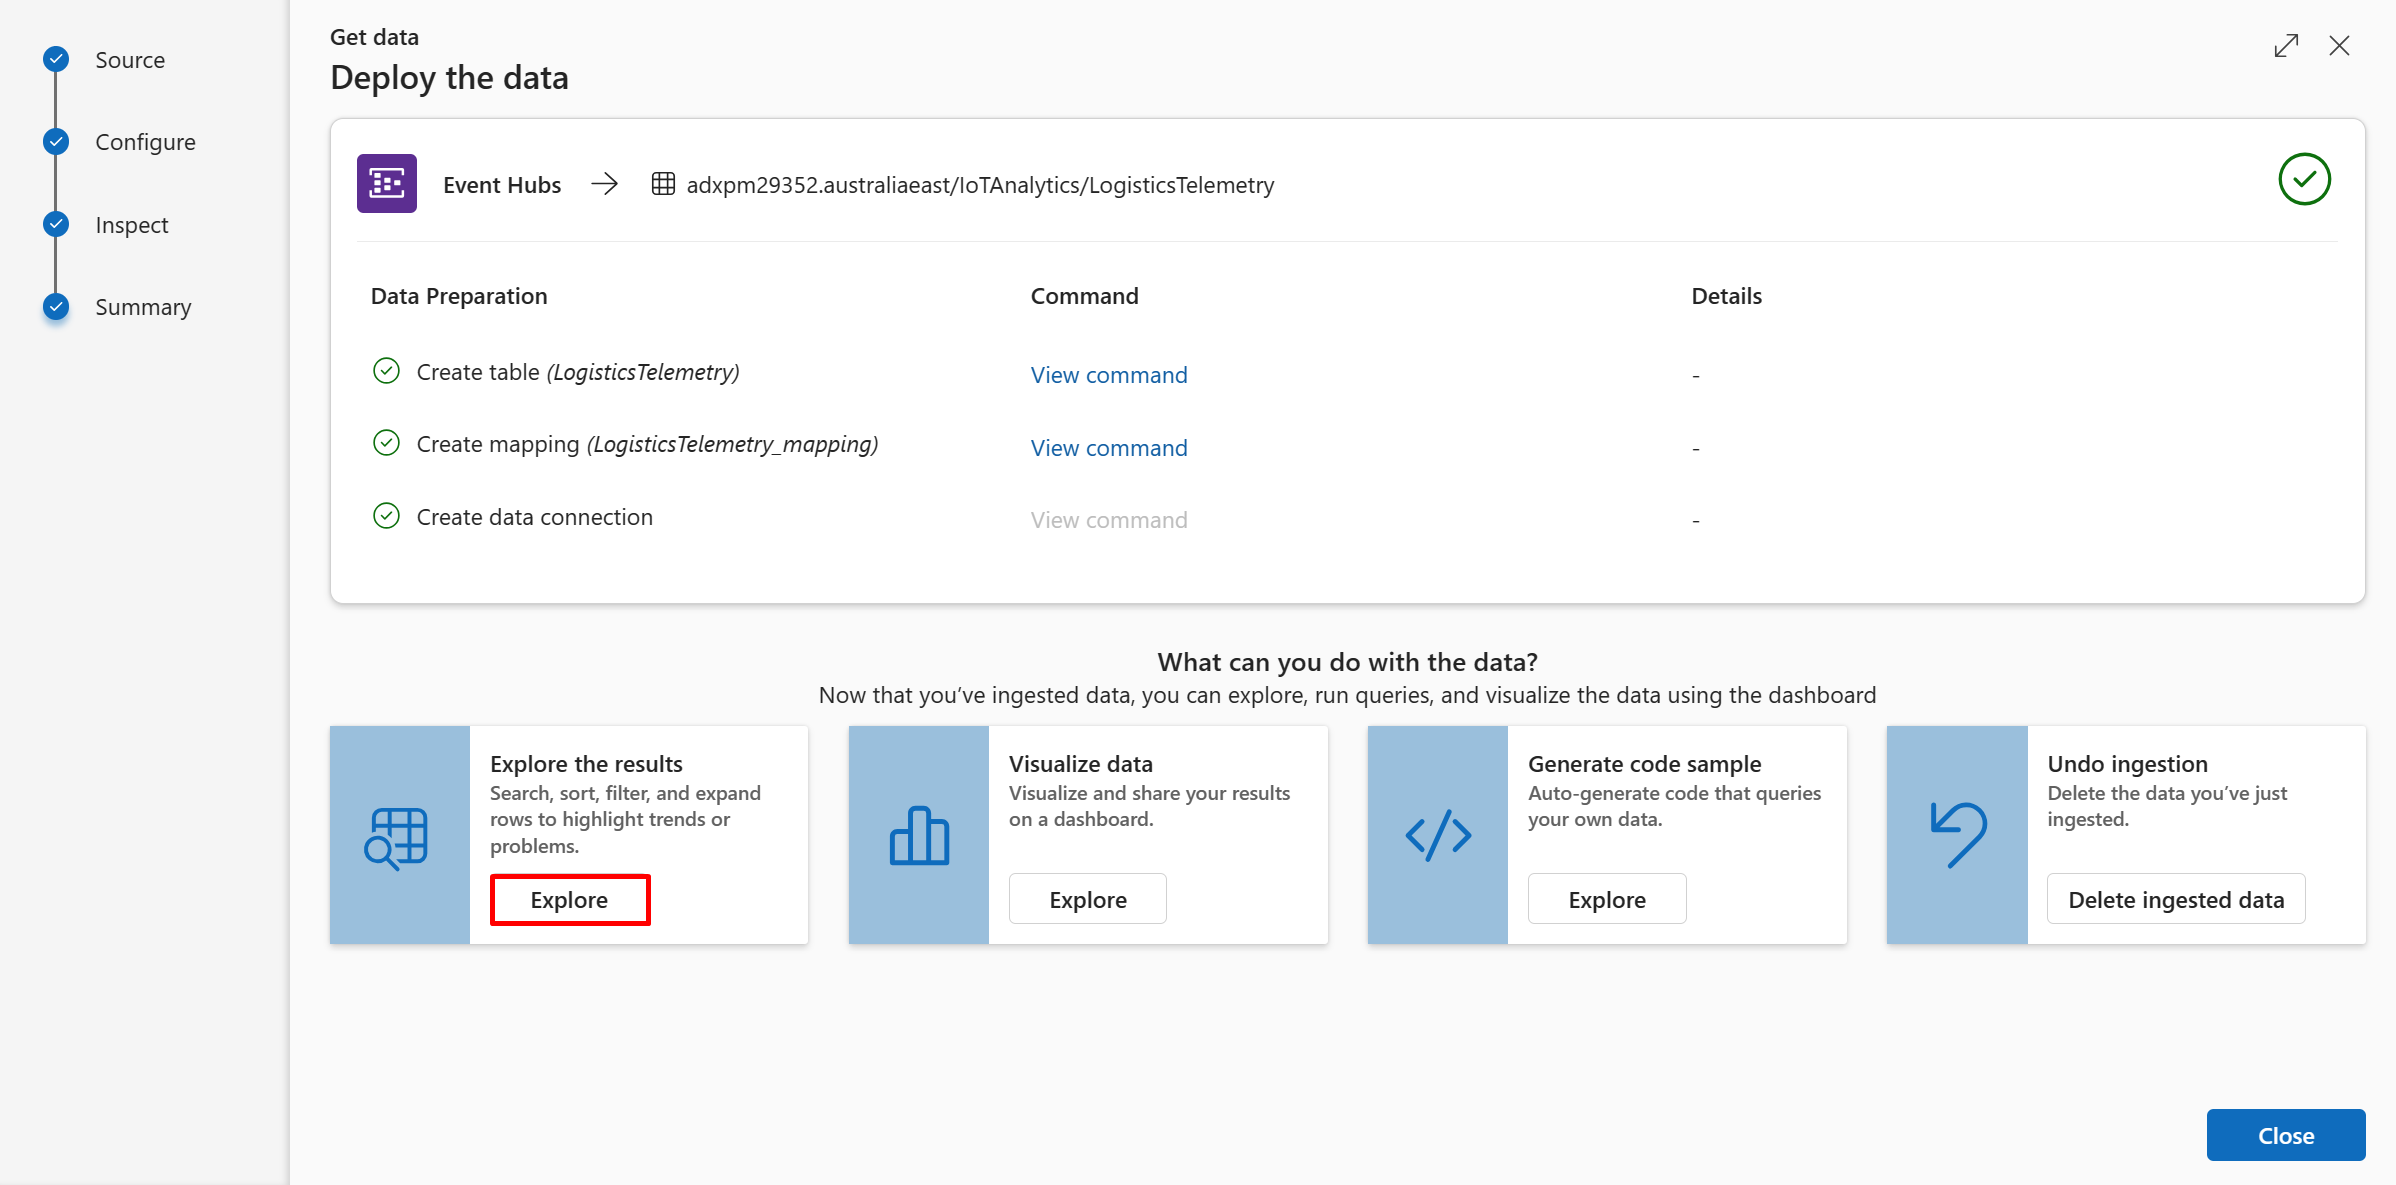
At the end of this process all steps should be marked with green check marks, indicating the table has been created, the mapping schema has been created, and the data connection has been successfully established. The cards below these steps give you options to explore your data.
Use the "Explore" link (under "What can you do with the data?"). Review the query and the data.
Notice that the query begins with a reference to the data table. This data is piped into the first and only operator in our query (take) and returns a specific number of arbitrary rows.
Run the query by either selecting the Run button above the query window or selecting Shift + Enter on the keyboard.
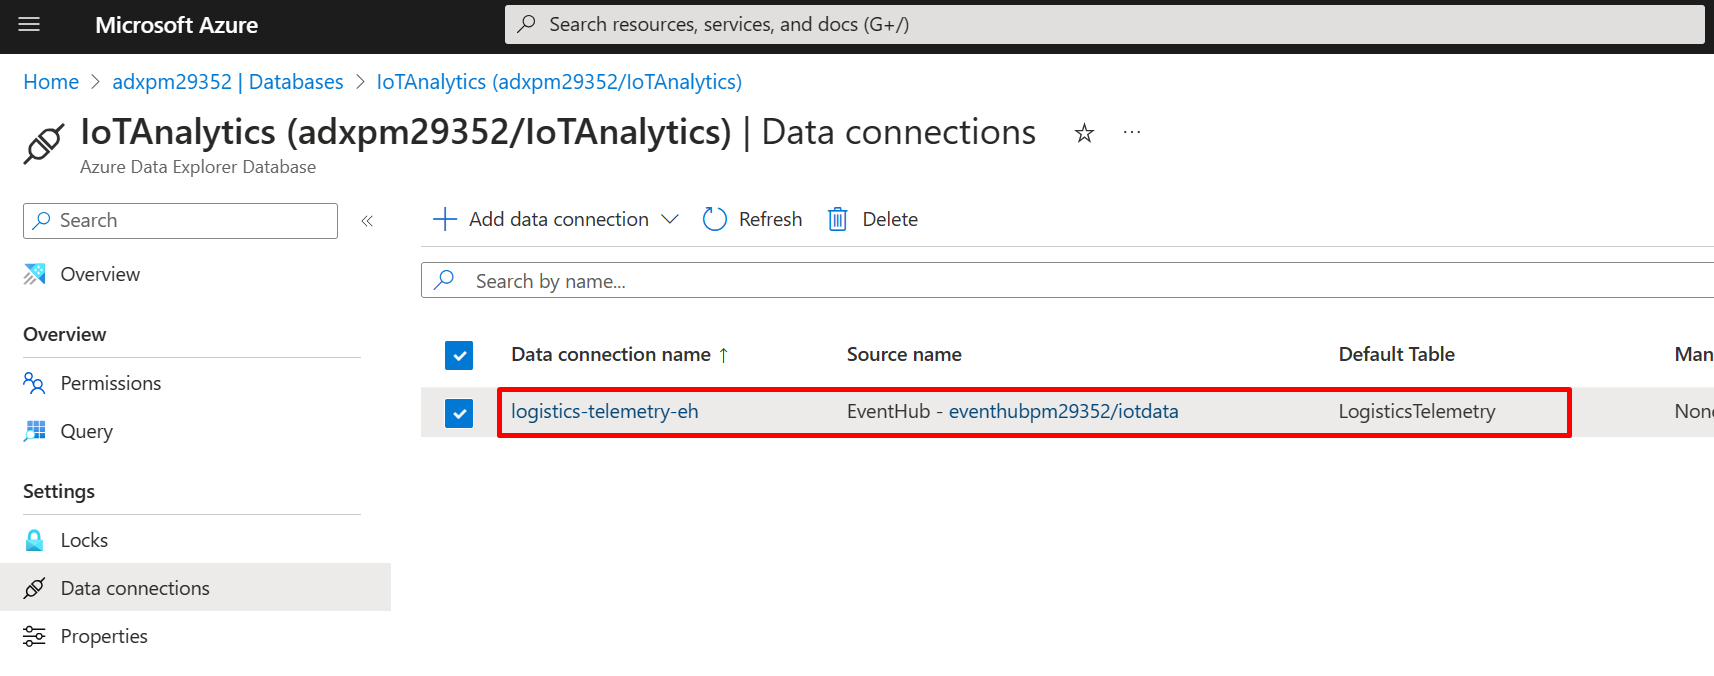
For additional context, you will notice that a new Event Hub Data Connection is created on the ADX Database resource in the Azure Portal. We can use this to monitor the ingestion status and to troubleshoot any issues.
Task 3: Use the "One-click" UI (User Interfaces) to create a data connection to Azure Blob Storage
This time, we will ingest data from an Azure Storage account. We will ingest two datasets:
- Logistics telemetry data. This time, the table will be named:
LogisticsTelemetryHistorical - Data on New York City Taxi rides, which will be used for Microhack 2. This table will be called:
NYCTaxiRides
With the "Try new Get Data" layout enabled on the top menu bar, select the "Get data" segment to get started.
Select the Azure Storage option to begin ingesting data from a Storage Account.
Make sure the cluster and the Database fields are correct. Select New table and name it LogisticsTelemetryHistorical. On the right, select Add URI and paste the SAS URL of the blob container. Alternatively, you can use the Select container option to choose the location of the historical data container manually.
Where do I find this information? The resource deployment part (on the Microhack's prerequisites) included the creation of a Storage Account named "iotmonitoringsa*****" (under the resource group ADXIoTAnalytics****). To get the SAS URL of the blob container, go to this storage account in the Azure portal. Once you're on the storage account page, go to the "Containers" menu and right-click on the container named "data". Click "Generate SAS". A side pane opens. In the "permissions" dropdown, add "list" along with "read". Click "Generate SAS token and URL" and copy the "Blob SAS URL".
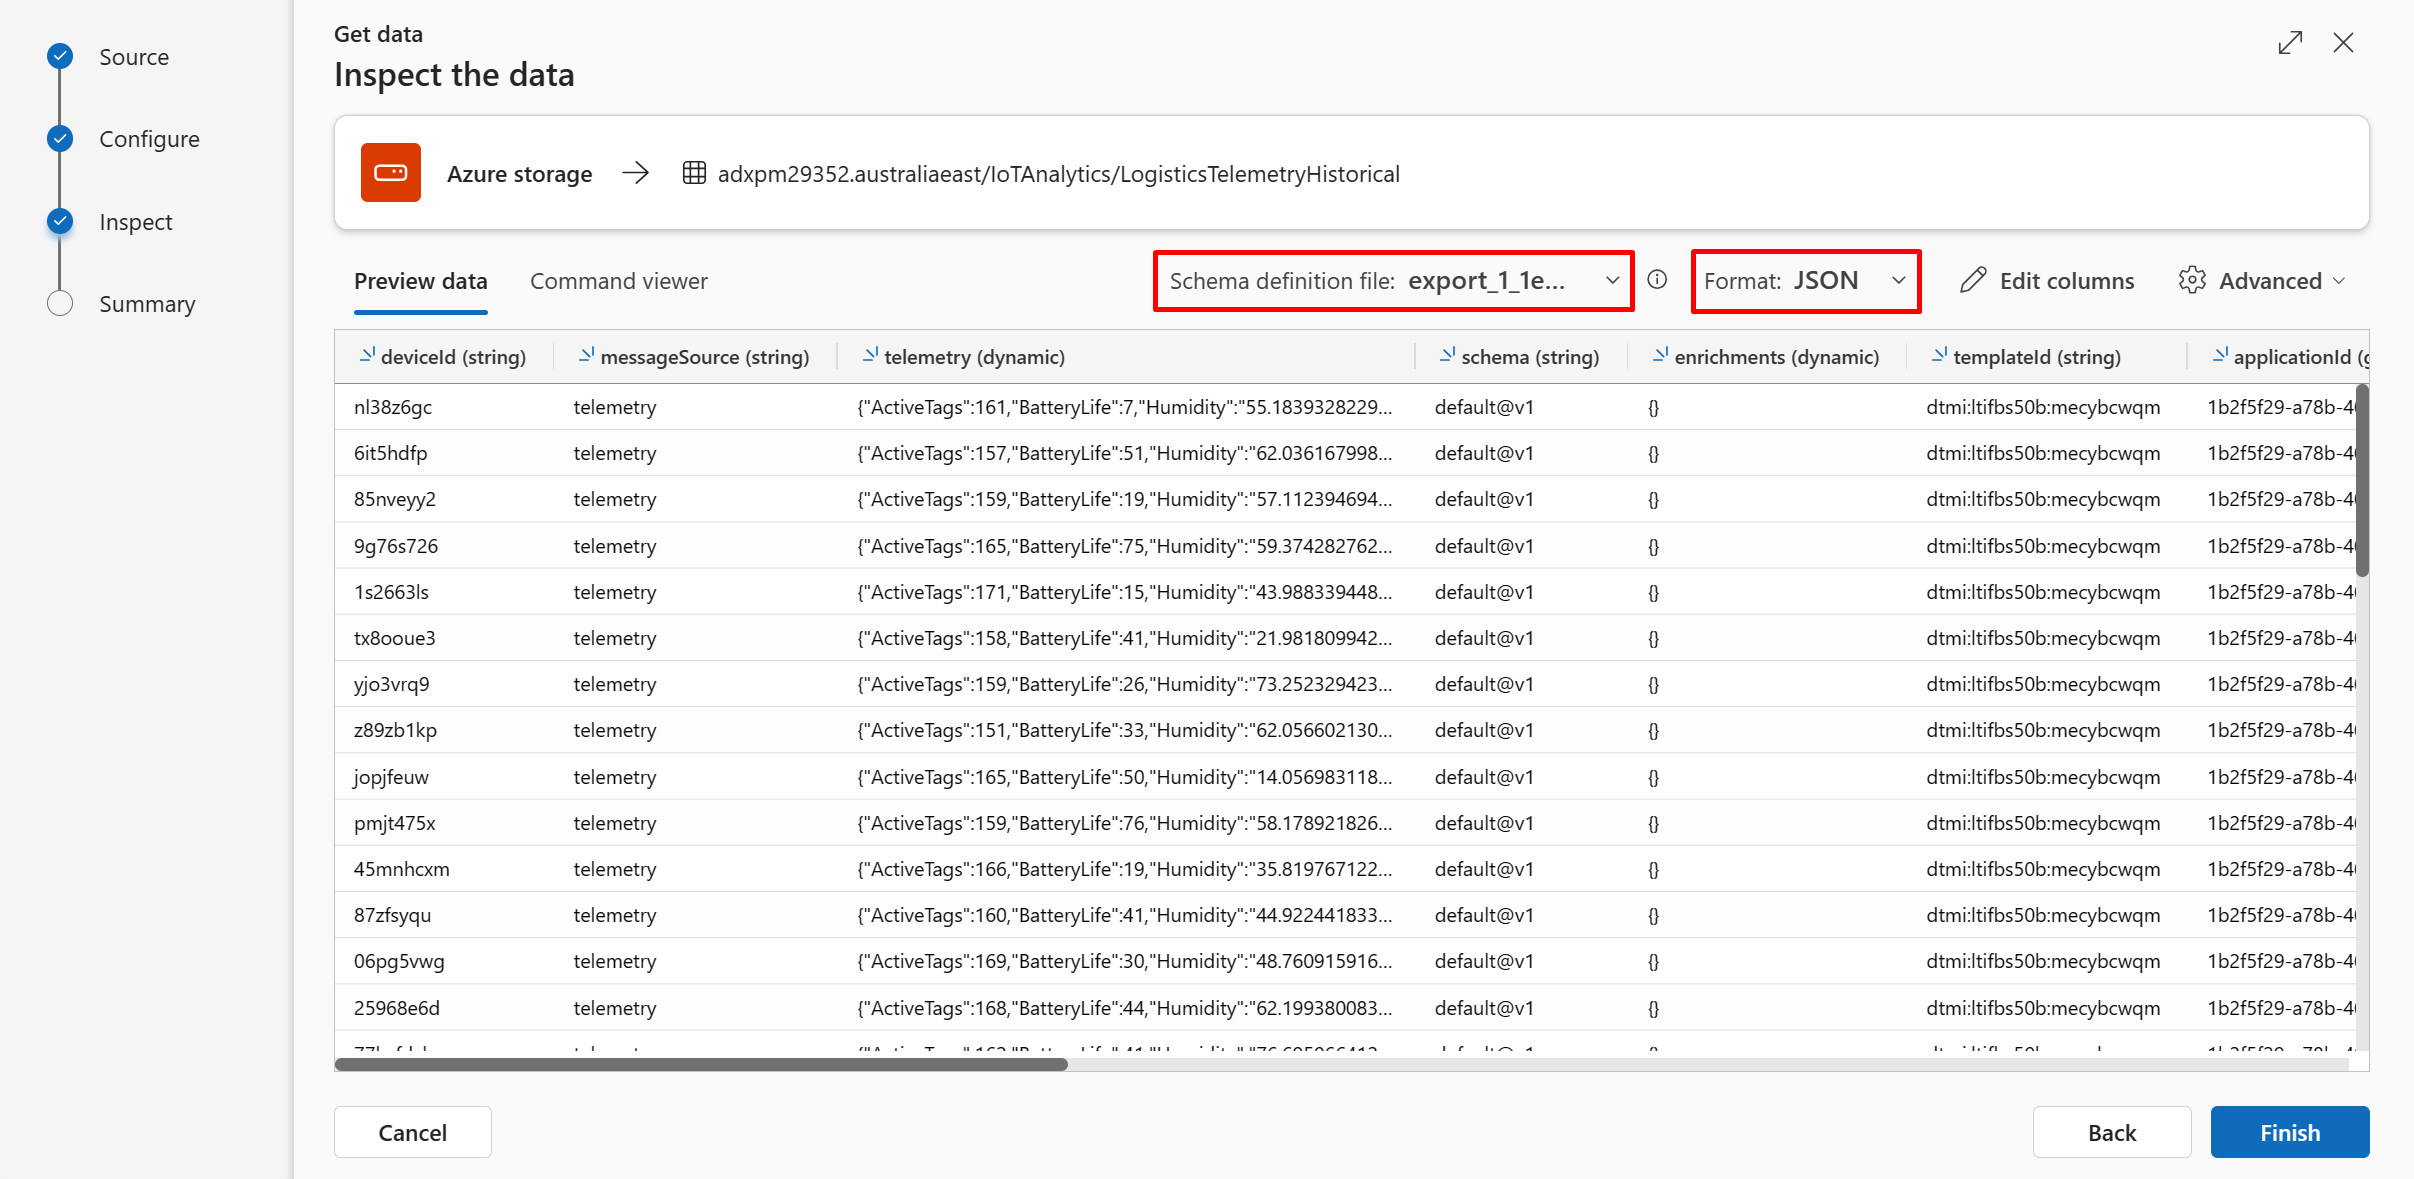
Go back to the ADX "One-click" UI. Paste the SAS URL and select one of the Schema defining file that start with "export_" (not all the files in that blob storage have the same schema. Later we will use the 'yellow_tripdata' file).
Make sure you use the JSON Data format and click Finish
Wait for the ingestion to be completed. For production modes, you could use Azure Event Grid for continuous blob ingestion. We won't use that option in this microhack.
Verify that data was ingested to the table by running the following query and observing the row count:
LogisticsTelemetryHistorical
| count
Repeat the above steps for ingesting data from the New York City Taxi dataset.
Relevant docs for this challenge:
- Azure Data Explorer data ingestion overview
- Use one-click ingestion to ingest data into Azure Data Explorer
Challenge 3: Starting with the basics of KQL
In this challenge you will write queries in the Kusto Query Language (KQL) to explore and gain insights from your data.
Expected Learning Outcomes
- Know how to write queries with KQL.
- Use KQL to explore data by using the most common operators.
What is a Kusto query?
A Kusto query is a read-only request to process data and return results. The request is stated in plain text that's easy to read, author, and automate. A Kusto query has one or more query statements and returns data in a tabular or graph format.
What is a tabular statement?
The most common kind of query statement is a tabular expression statement. Both its input and its output consist of tables or tabular datasets.
Tabular statements contain zero or more operators. Each operator starts with a tabular input and returns a tabular output. Operators are sequenced by a pipe (|). Data flows, or is "piped", from one operator to the next. The data is filtered or manipulated at each step and then fed into the following step.
Think of it like a funnel, where you start out with an entire data table. Each time the data passes through another operator, it's filtered, rearranged, or summarized. Because the piping of information from one operator to another is sequential, the query's operator order is important. At the end of the funnel, you're left with a refined output.
Let's look at an example query:
LogisticsTelemetry
| where enqueuedTime > ago(7d)
| where messageSource == "telemetry"
| count
This query has a single tabular expression statement. The statement begins with a reference to the table LogisticsTelemetry and contains the operators where and count. Each operator is separated by a pipe. The data rows for the source table are filtered by the value of the enqueuedTime column and then filtered by the value of the messageSource column. In the last line, the query returns a table with a single column and a single row that contains the count of the remaining rows.
References:
Task 1: Basic KQL queries - explore the data
In this task, you will see some KQL examples. For this task, we will use the table LogisticsTelemetry, which obtains data from the Event Hub.
Execute the queries and view the results. KQL queries can be used to filter data and return specific information. Now, you'll learn how to choose specific rows of the data. The where operator filters results that satisfy a certain condition.
LogisticsTelemetry
| where deviceId startswith "x"
| take 10
Similarly, you can filter where the time of an event occurred more than a certain number of years/days/minutes ago. For example, run the following query, where 2m means 2 minutes:
LogisticsTelemetry
| where enqueuedTime > ago(2m)
| take 10
📝 Tip: You can use the Shift + Enter keyboard shortcut to run the selected KQL code in the Kusto Web Explorer.
Find out how many records are in the table
LogisticsTelemetry
| summarize count() // or: count
Find out how many records have an enqueuedTime bigger than the last 10 minutes (received in the last 10 minutes)
LogisticsTelemetry
| where enqueuedTime > ago(10m)
| summarize count()
Find out how many records have deviceId that starts with "x"
LogisticsTelemetry
| where deviceId startswith "x"
| summarize count()
Find out how many records have a deviceId that starts with "x", per device ID (aggregated by device ID)
LogisticsTelemetry
| where deviceId startswith "x"
| summarize count() by deviceId
Find out how many records start with "x", per device ID (aggregated by device ID) and render the result to a piechart
LogisticsTelemetry
| where deviceId startswith "x"
| summarize count() by deviceId
| render piechart
KQL makes it simple to access fields in JSON and treat them like an independent column:
LogisticsTelemetry
// | where enqueuedTime > ago(10d)
| extend h = telemetry.Humidity
| summarize avg(toint(h)) by bin(enqueuedTime, 1h)
| render timechart
📝 Tip: You can use the Alt + Shift + F keyboard shortcut to auto-format your KQL code in the Kusto Web Explorer and make it more readable.
Brilliant! You can see how easy it is to query data in ADX using the Kusto Query Language (KQL). Already, we derived basic insights from our data.
For the following tasks, we will continue using the LogisticsTelemetry table and begin introducing the LogisticsTelemetryHistorical table.
Task 2: Explore the table and columns 🎓
📆 Use table: LogisticsTelemetry
✍🏻 Write a query to add NumOfTagsCalculated, Shock and Temp as calculated columns with the data type: real, then get the schema of the table.
🕵🏻 Hint 1: Observe that new columns like NumOfTagsCalculated, Shock, Temp are extracted from the telemetry payload and do not exist on the LogisticsTelemetry table.
🕵🏻 Hint 2: NumOfTagsCalculated is the total tag count minus the lost tags.
🤔 Do you know why the default column type is dynamic when we attempt to access a nested JSON element, and how we parse it to type: real?
Example result:
References:
Task 3: Keep the columns of your interest 🎓
📆 Use table: LogisticsTelemetry
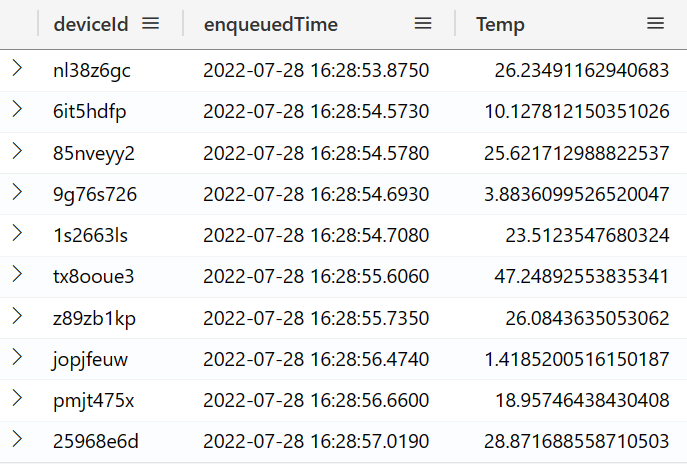
✍🏻 Write a query to get only the specific desired columns: deviceId, enqueuedTime, Temp. Take an arbitrary 10 records.
🕵🏻 Hint: Temp doesn't exist as a column in the source table, but you have already figured out how to extract it in the previous task.
Example result:
References:
Task 4: Filter the output 🎓
📆 Use table: LogisticsTelemetry
✍🏻 Write a query to get only these specific columns: deviceId, enqueuedTime, Temp. Take an arbitrary 10 records from the past 90 days.
🕵🏻 Hint 1: "ago"
🕵🏻 Hint 2: In case you see 0 records, remember that operators are sequenced by a pipe (|). Data is piped, from one operator to the next. The data is filtered or manipulated at each step and then fed into the following step. By using the take operator, there is no guarantee which records are returned.
References:
Task 5: Sorting the results 🎓
📆 Use table: LogisticsTelemetry
✍🏻 Write a query to get the 5 records which have the highest temperature.
✍🏻 Write another query get the 5 records which have the lowest temperature.
🕵🏻 Hint: Try a few different operators and submit both queries in the same Answer Sheet response.
References:
Task 6: Reorder, rename, add columns 🎓
📆 Use table: LogisticsTelemetry
✍🏻 Currently, all temperature values are in Fahrenheit. Write a query to convert Fahrenheit temperatures to Celsius temperatures. For readability, show the Fahrenheit temperature and the Celsius temperatures as the 2 left-most columns. You can use the following formula: °C = (°F – 32) * (5.0/9.0)
Take 5 random records from the past week.
🕵🏻 Hint 1: The project operator provides a lot more features.
🕵🏻 Hint 2: We used 5.0 and 9.0, rather than 5 and 9 to ensure these numbers were read as real data types (double-precision floating-point format), rather than long (a signed integer, Int64).
Example result:
References:
Task 7: Total number of records 🎓
📆 Use table: LogisticsTelemetry
✍🏻 Write a query to find out how many records are in the table.
🤔 Can you explain why the number of records in the LogisticsTelemetry table changes every few minutes while the number of records in the LogisticsTelemetryHistorical table doesn't?
References:
Task 8: Aggregations and string operations 🎓
📆 Use table: LogisticsTelemetryHistorical
✍🏻 Write a query over the historical data to find out how many records have a deviceId starting with 'x'.
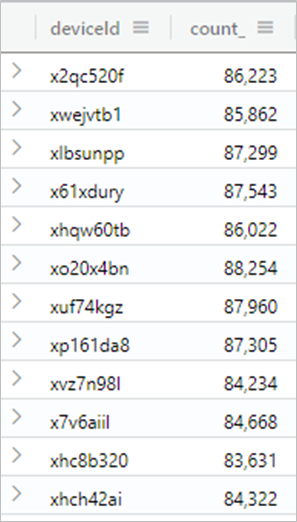
✍🏻 Write another query to find out how many records have a deviceId starting with 'x', per device ID (aggregated by device id).
Example result for the second query:
References:
Task 9: Render a chart 🎓
📆 Use table: LogisticsTelemetryHistorical
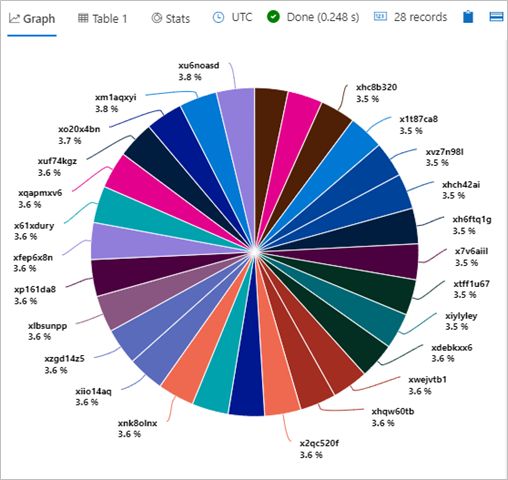
✍🏻 Write a query over the historical data to find out how many records start with "x", per device ID (aggregated by device ID) and render a piechart.
Example result:
References:
Task 10: Create bins and visualize time series 🎓
📆 Use table: LogisticsTelemetryHistorical
✍🏻 Write a query to show a timechart of the number of historical records over time. Use 10-minute bins (buckets). Each point on the timechart represent the number of devices in that bucket.
Example result:
References:
Task 11: Aggregations with time series visualizations 🎓
📆 Use table: LogisticsTelemetryHistorical
✍🏻 Write a query to show a timechart of the historical data's average temperature over time. Use 30-minute bins (buckets). Each point on the timechart represent the average temperature in that 30-minute period.
🕵🏻 Hint: summarize avg(Temp) by bin(enqueuedTime, 30m)
Example result:
References:
🎉 Congrats! You've completed the first Microhack. Keep going with Microhack 2: Data exploration and visualization using Kusto Query Language (KQL)


