This pr is auto merged as it contains a mandatory file and is opened for more than 10 days. |
||
|---|---|---|
| Technical Deployment Guide | ||
| User Guide | ||
| Walkthrough 1 - Promotion Simulation | ||
| assets | ||
| core | ||
| images | ||
| .gitignore | ||
| LICENSE | ||
| README.md | ||
| SECURITY.md | ||
README.md
Interactive Price Analytics
Summary
The Interactive Pricing Analytics solution uses your sales history transactional data to predict how the demand for your products responds to the prices you offer. This way you can recommend pricing changes, and simulate how they would affect product demand, at the level of individual products.
The core of the solution is the ability to estimate price elasticities for every product, site, channel and customer segment in your business. These elasticity models avoid most common demand confounding effects by using an advanced modeling approach combining the strengths of machine learning and econometrics.
The solution produces Power BI visualizations and allows interactive simulation in Excel.
Description
The Interactive Pricing Analytics (IPA) solution brings price elasticity modeling and pricing recommendations to any business with an Azure subscription. It alleviates confounding by the "Double-ML" approach, which subtracts out the predictable components of price and demand variation (such as seasonal swings) before estimating the elasticity. The residual unexplained variation in price is taken to be due to exogenous price changes and the unexplained demand response to be the true price effect. Additionally, the solution can be customized to use any data reflecting other potential external demand drivers.
Additionally, estimating demand for slow-moving items is a challenge, and existing pricing solutions often only give estimates at product category level. Our pricing solution uses "hierarchical regularization" to produce consistent estimates down to the individual product level in such data-poor situations. Simply put, in absence of strong evidence, the model borrows information from other items in the same category, same items in other sites, and so on. As number of transactions in an individual item increases, its elasticity estimate will be fine-tuned more specifically.
The services in this solution include
- showing you in one glance how elastic your product demand is,
- providing pricing recommendations for every product in your item catalog,
- discovering which products are related as substitutes and complements,
- simulating promotional pricing scenarios.
All information is provided at the fine-grained level that you need for detailed control of your price and inventory: item, site, channel and customer segment.
Additional detail on the data science of prices are in our blog post.
Solution Architecture
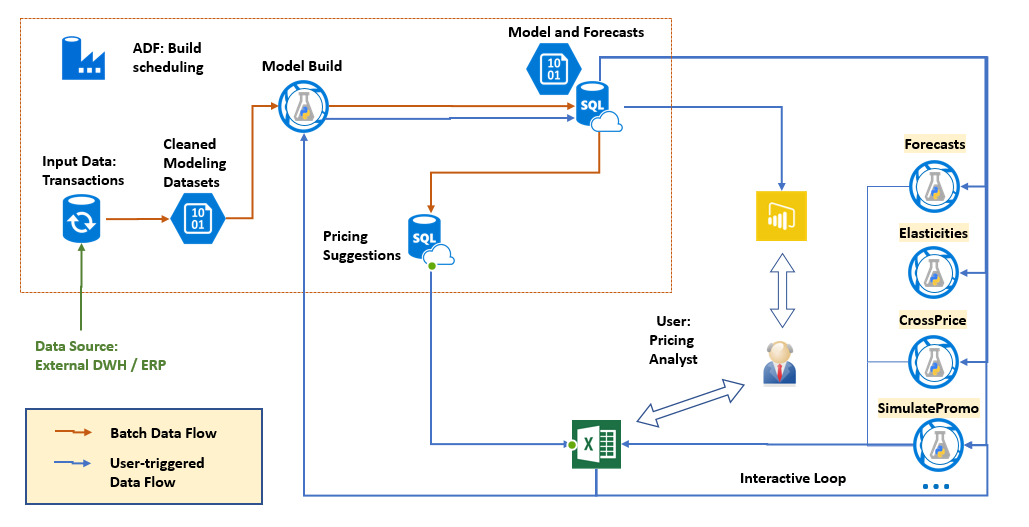
Azure Solutions are composed of cloud-based analytics services for data ingestion, data storage, scheduling and advanced analytics components. These services can be integrated with your current production systems. This Solution combines these Azure services:
- A SQL server to store your transactional data and the generated model predictions.
- Azure Data Factory, which schedules weekly model refreshes.
- There are more than 10 elasticity modeling core services, which are exposed by AzureML.
- The provided Excel spreadsheets run the predictive Web Services.
- The results display in a PowerBI dashboard.
Please read the Technical Deployment Guide for a more detailed discussion.
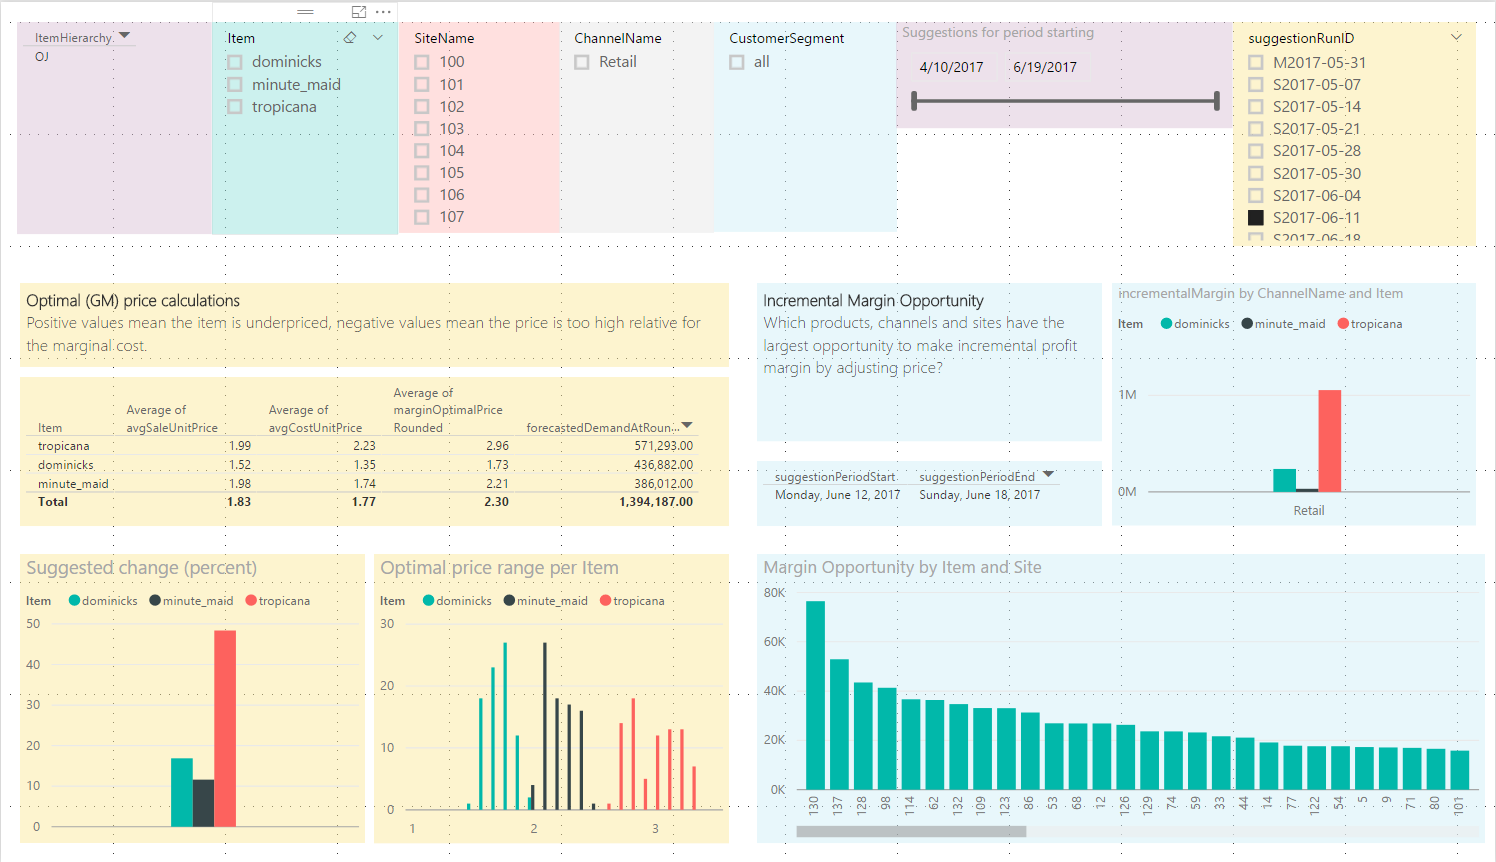
Solution Dashboard
The solution dashboard's most actionable tab is the Pricing Suggestion tab. It tells you which of your items are underpriced, overpriced, and suggests an optimal price for each item, as well as the predicted impact of adopting the suggestion. The suggestions are prioritized by the largest opportunity to earn incremental gross margin.
Getting Started
Estimated Provisioning time: 15 minutes
You can install a running copy of this solution in your existing Azure subscription. Deploy the solution from the Cortana Intelligence Quick Start Page. Instructions at the end of the deployment will guide you further.
The solution deploys with an example data set of orange juice prices.
Business Audiences
While the solution is deploying, get a head start and
- peruse the User Guide for a full set of usage instruction
- download the interactive Excel Worksheet
Technical Audiences
See the Technical Deployment Guide for a full set of instructions on how to use and customize this solution. For technical problems or questions about deploying this solution, please post in the issues tab of the repository.

