6.1 KiB
6.1 KiB
home
Web and Data Monitoring E2E Example
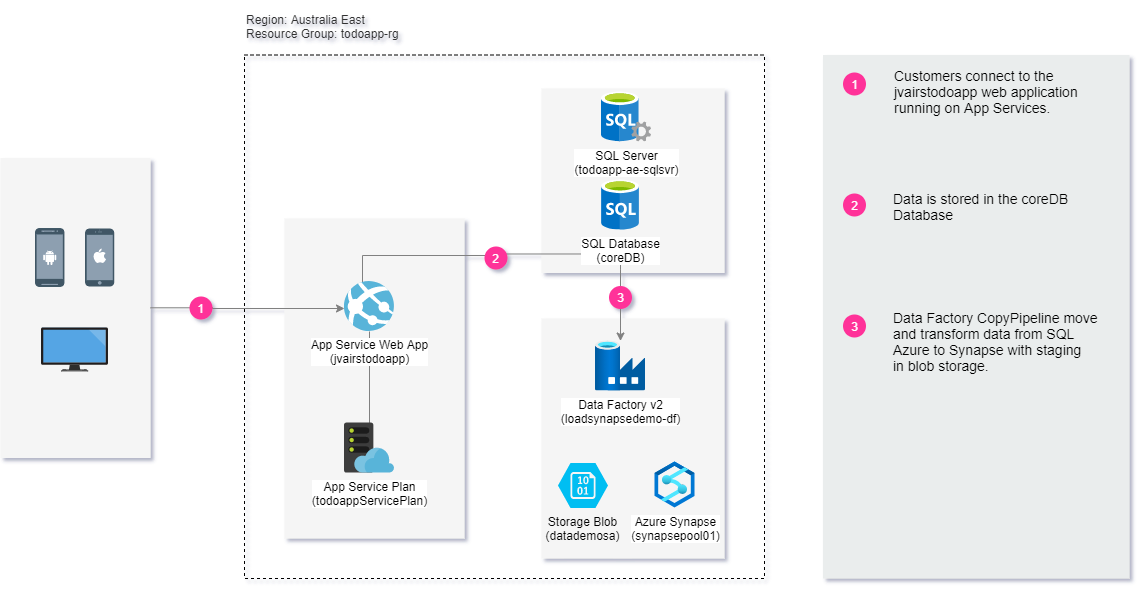
Architecture
Application architecture without monitoring.
Application Criticality and Monitoring Requirements
Define application criticality and monitoring requirements.
Business Commitment
- Criticality: Mission Critical
- Time/Value Impact: $1m
- Commitment Level: High Availability Commitment
Monitoring Requirements
Requirements for health monitoring
- An operator should be alerted within seconds if any part of the system is unhealthy.
- An operator should be able to ascertain which parts of the system are functioning normally and experiencing problems.
- System health should be highlighted through a traffic-light system:
- Red for unhealthy.
- Yellow for partially healthy.
- Green for healthy.
Requirements for availability monitoring
- An Operator should be able to view historical availability of each system and subsystem, and use this information to spot any trends.
- A monitoring solution should provide an immediate and historical view of the availability or unavailability of each subsystem.
- An Operator should be able to examine user actions if these actions fail when they attempt to communicate with a service.
Requirements for performance monitoring
- An Operator should have access to:
- The response rates for user requests.
- The number of concurrent user requests.
- The volume of network traffic.
- The rates at which business transactions are being completed.
- The average processing time for requests.
- The number of concurrent users versus request latency times (how long it takes to start processing a request after the user has sent it).
- The number of concurrent users versus the average response time (how long it takes to complete a request after it has started processing).
- The volume of requests versus the number of processing errors.
- Memory utilization.
- Number of threads.
- CPU processing time.
- All visualizations should allow an operator to specify a time period. The displayed data might be a snapshot of the current situation and/or a historical view of the performance.
- An operator should be able to raise an alert based on any performance measure for any specified value during any specified time interval.
Requirements for SLA monitoring
- An operator should be able to determine at a glance whether the system is meeting the agreed SLAs or not.
- The following indicators should be available:
- The percentage of service uptime
- The application throughput (measured in terms of successful transactions and/or operations per second).
- The number of successful/failing application requests.
- The number of application and system faults, exceptions, and warnings. All of these indicators should be capable of being filtered by a specified period of time up to 2 years.
- System uptime needs to be defined carefully. In a system that uses redundancy to ensure maximum availability, individual instances of elements might fail, but the system can remain functional.
- System uptime as presented by health monitoring should indicate the aggregate uptime of each element and not necessarily whether the system has actually halted. Additionally, failures might be isolated. So even if a specific system is unavailable, the remainder of the system might remain available, although with decreased functionality.
- For alerting purposes, the system should be able to raise an event if any of the high-level indicators exceed a specified threshold. The lower-level details of the various factors that compose the high-level indicator should be available as contextual data to the alerting system.
Requirements for auditing
- An analyst must be able to trace the sequence of relevant control plane change operations.
- Data must be available and searchable for a period of 2 years.
Requirements for usage monitoring
- To examine system usage, an operator will need access to the following information:
- The number of requests that are processed by each subsystem and directed to each resource.
- Where users are located.
- What devices are being used to access the system.
- What percentage of users are returning to the system over time.
- How system performance affect user behavior.
- The performance of individual web pages.
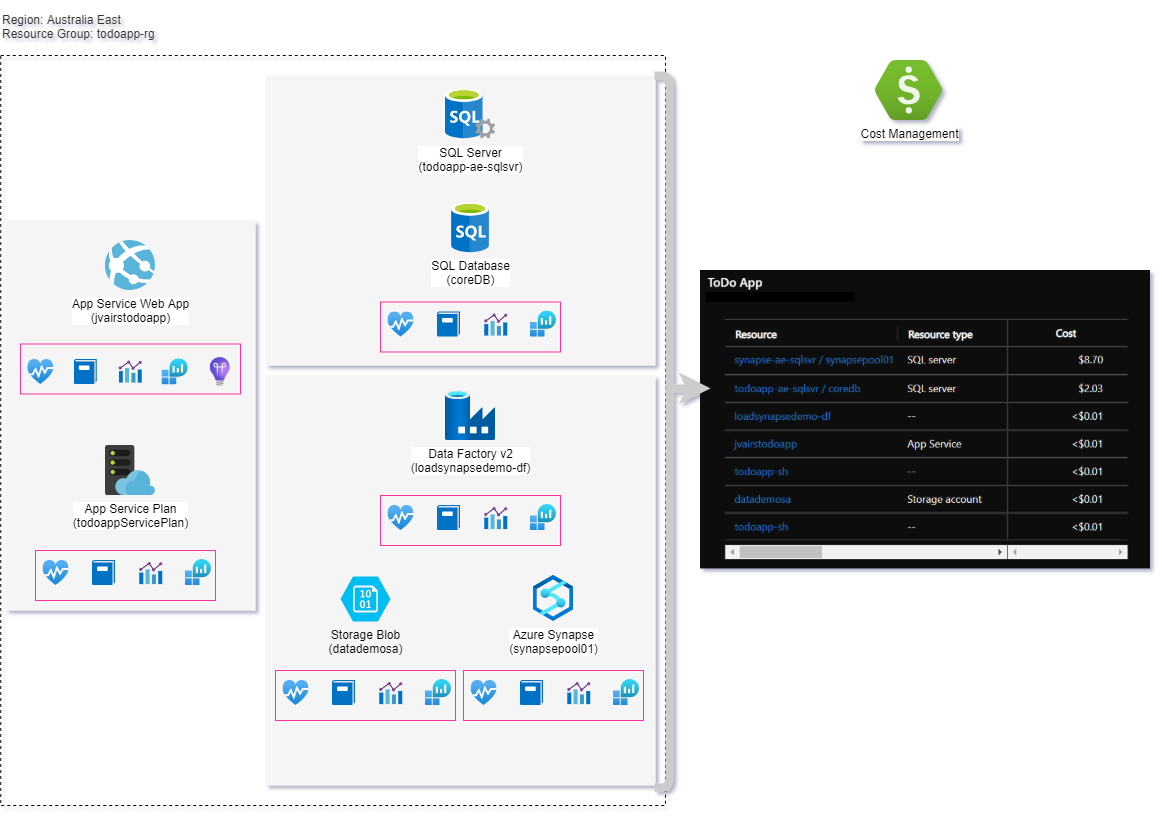
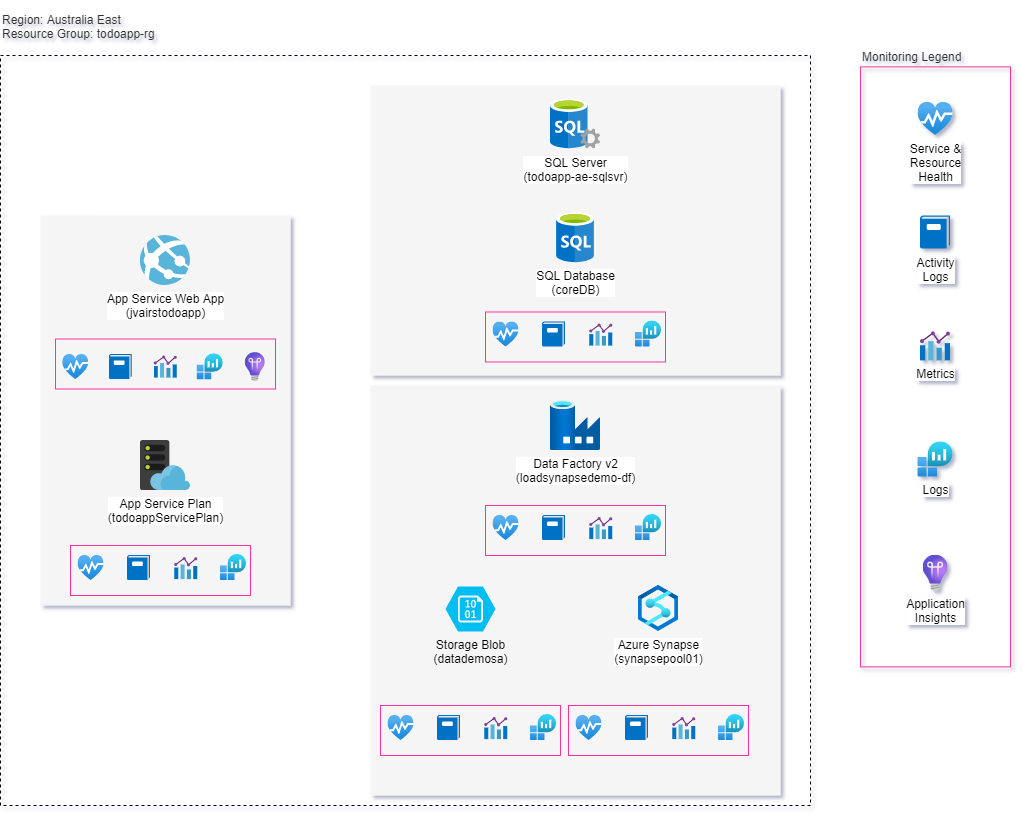
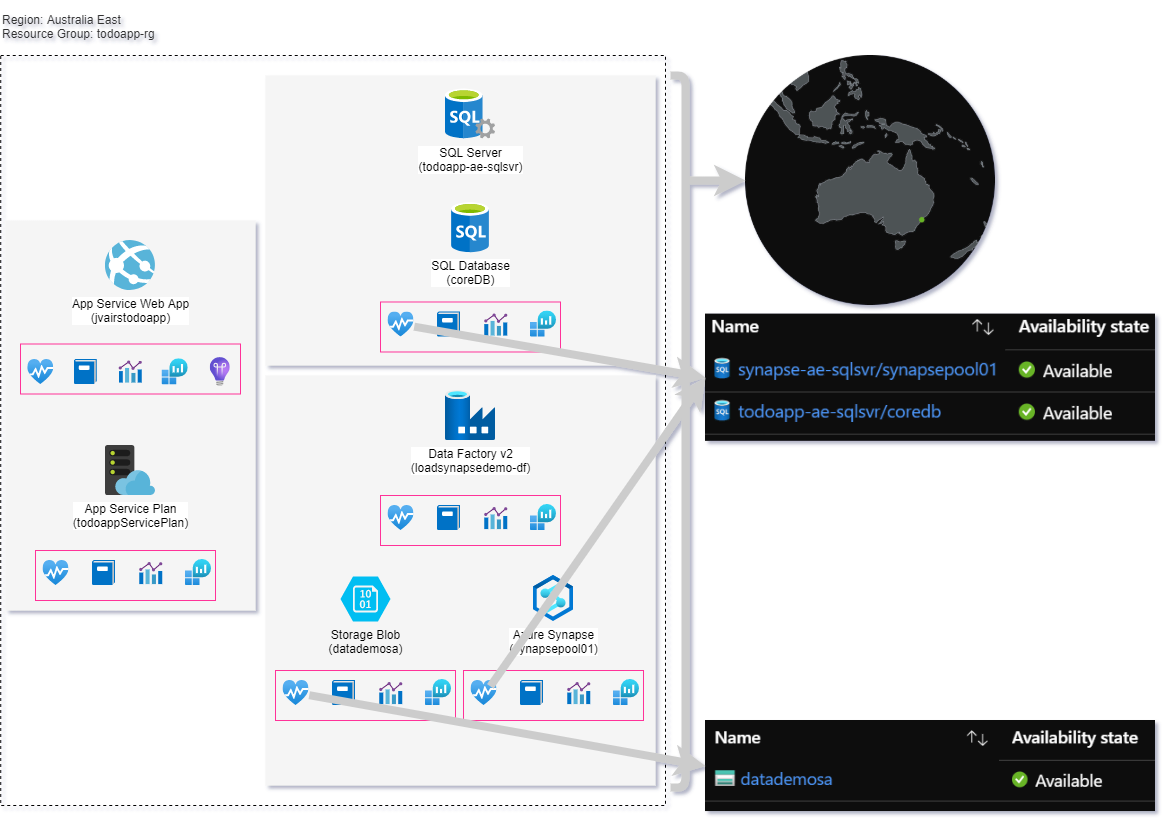
Monitoring
Application architecture with monitoring to meet requirements.
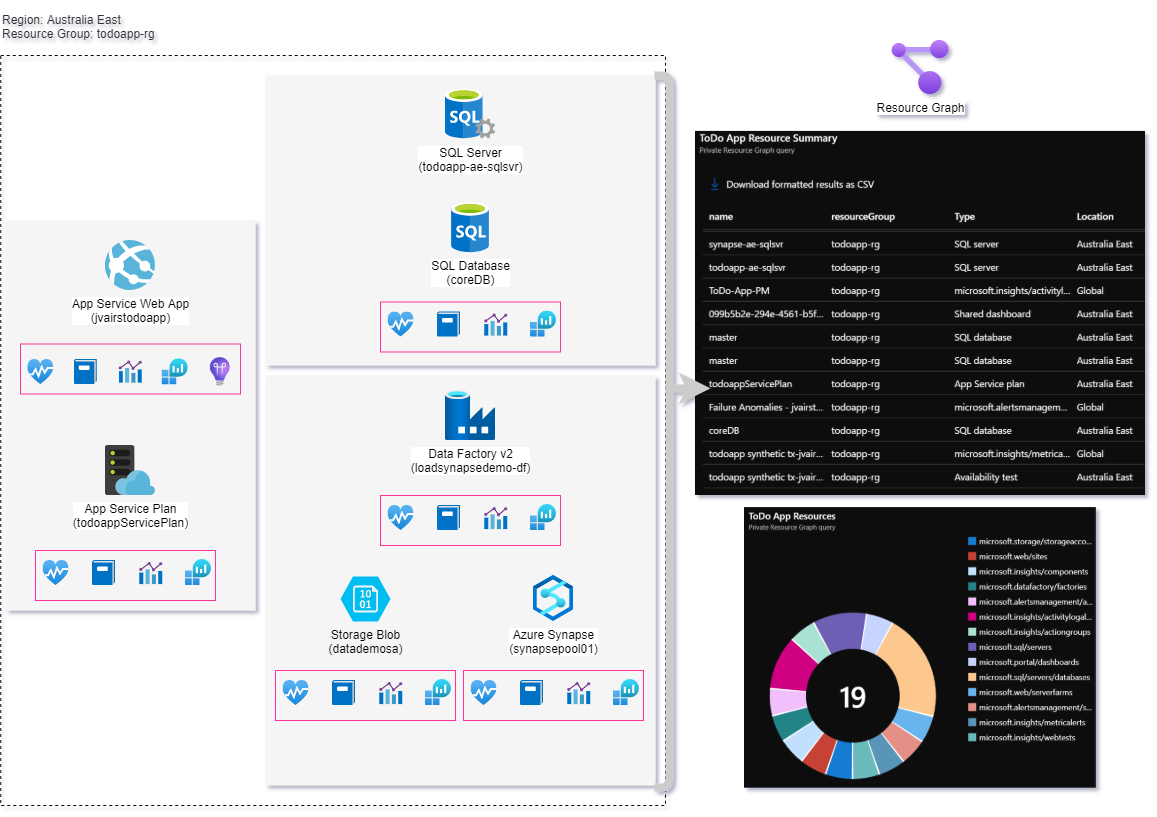
Inventory
Inventory of application components using Azure Resource Graph Explorer.
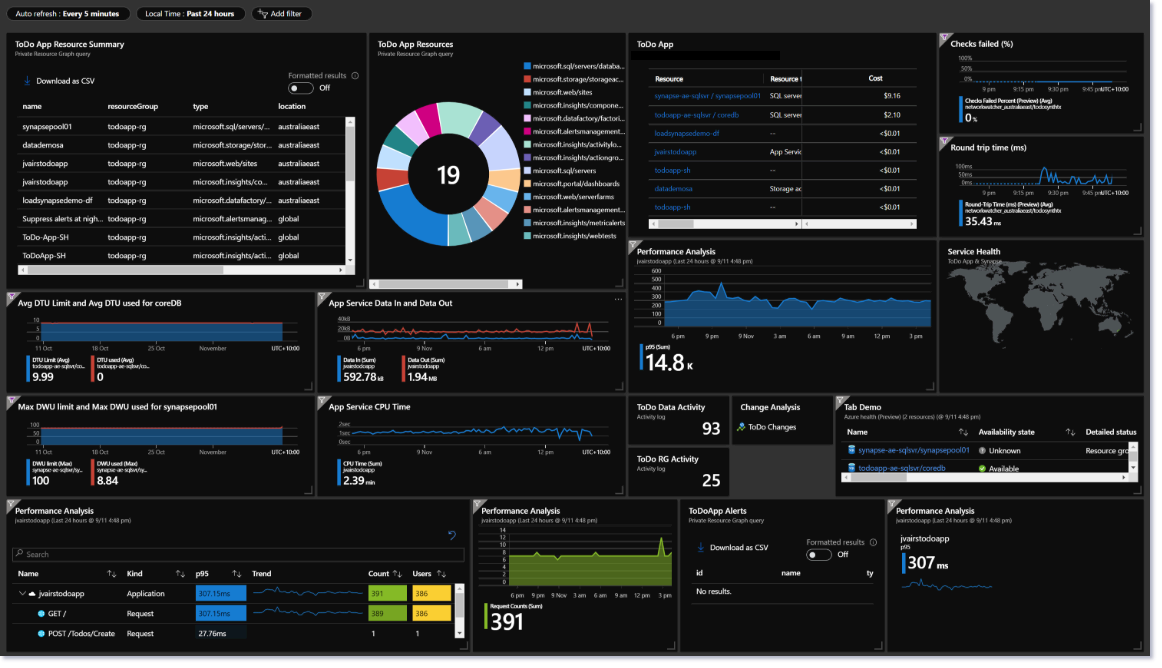
Web App Monitoring
Web App monitoring extract 1.
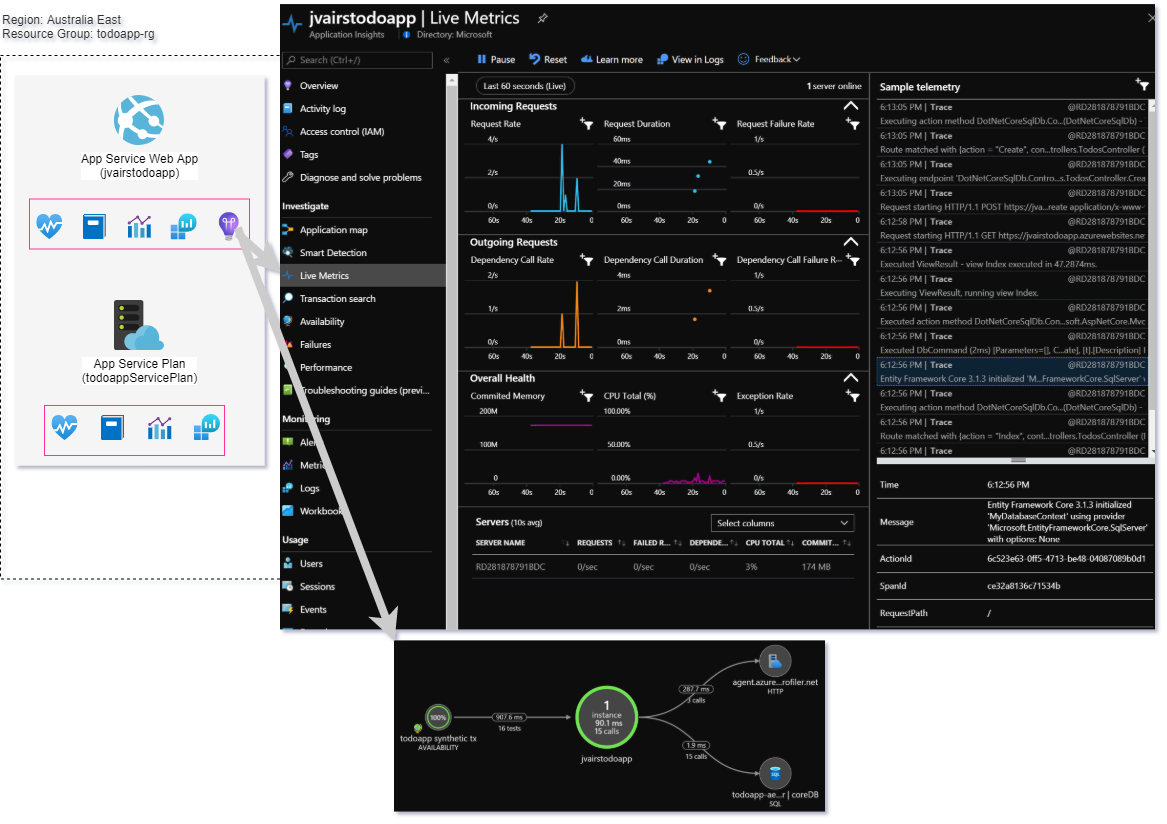 Web App monitoring extract 2.
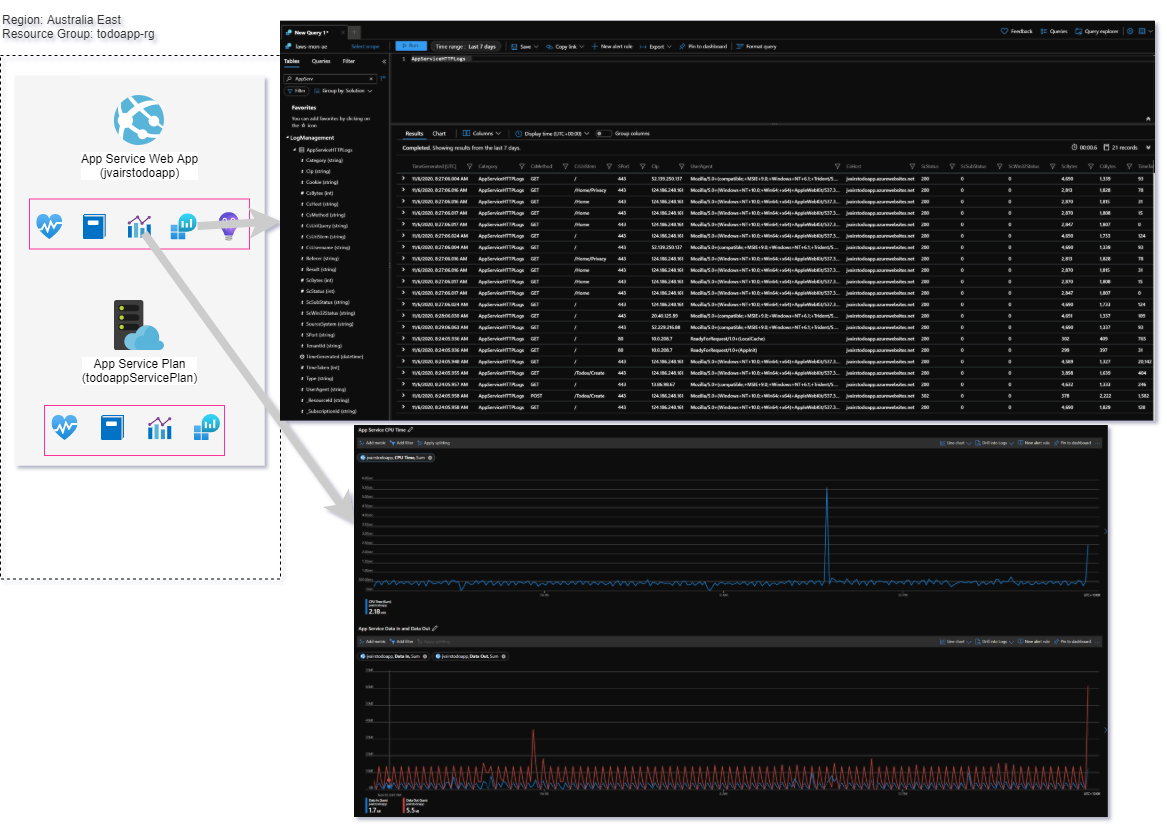
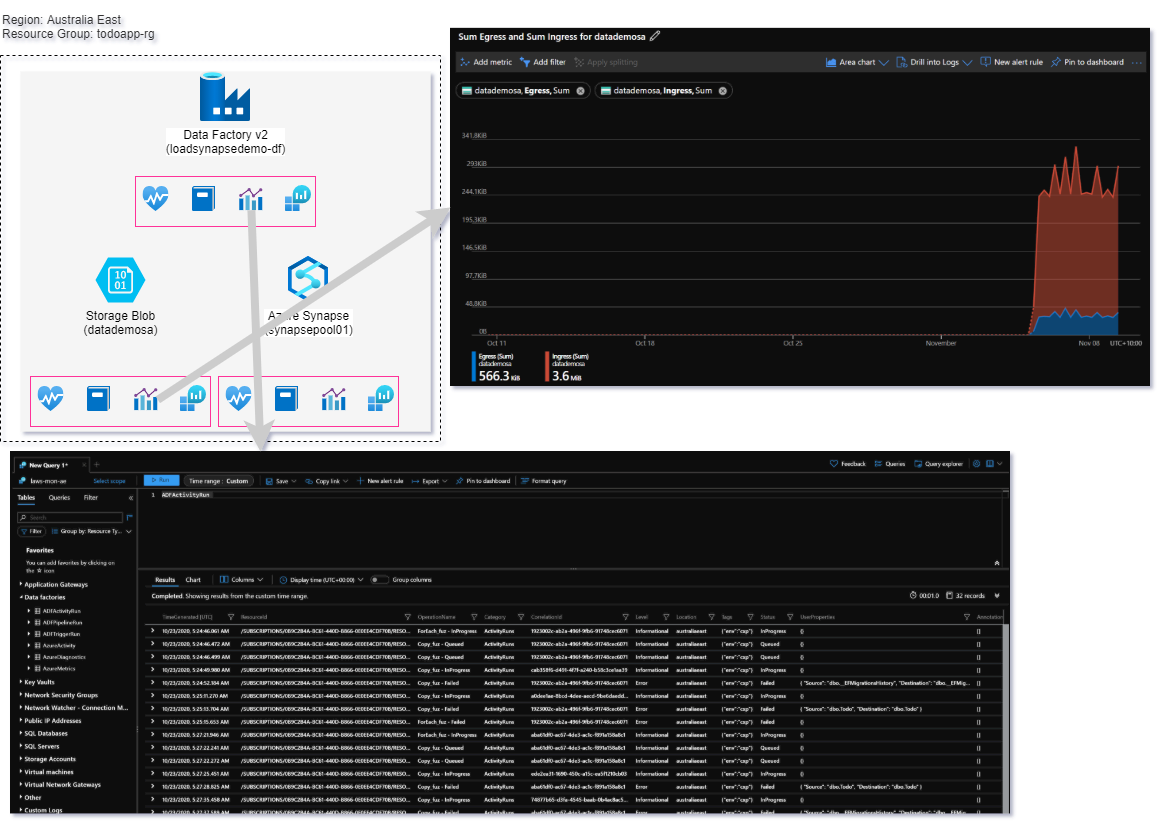
Data Monitoring
Data monitoring extract 1.
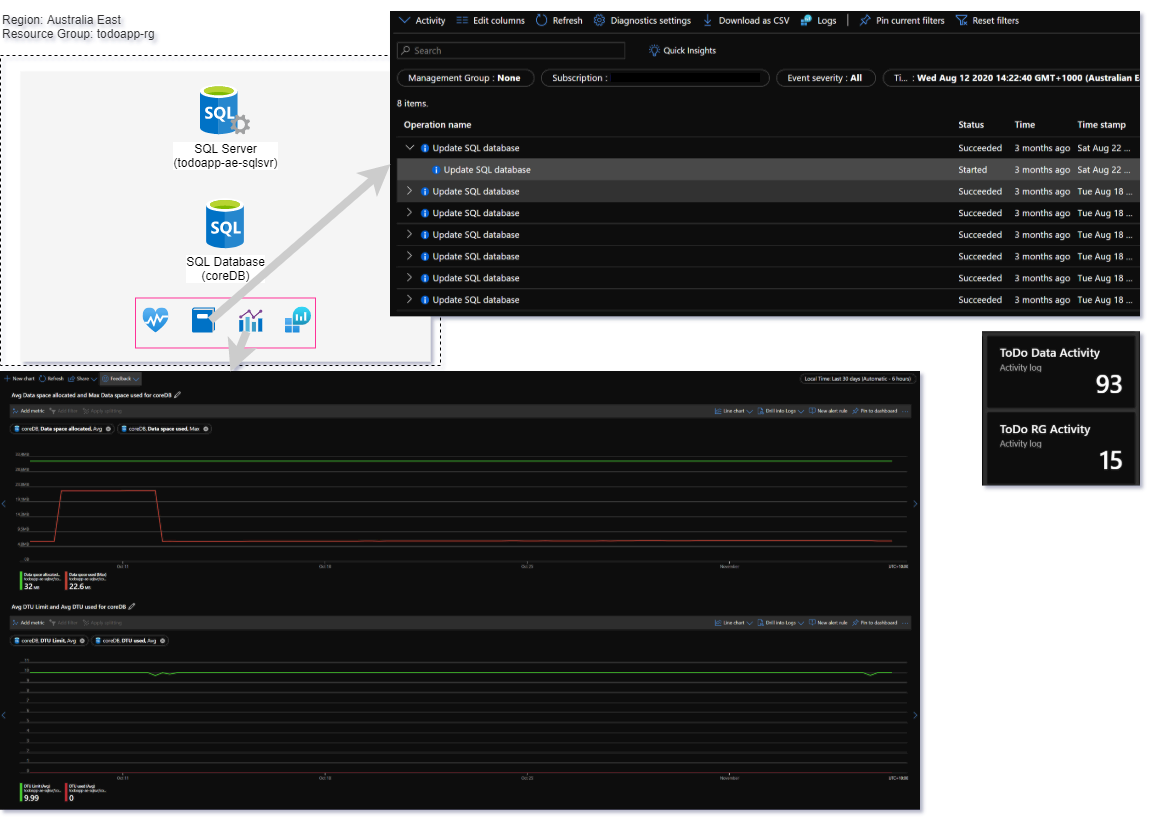 Data monitoring extract 2.
Service and Resource Health Monitoring
Service and Resource health monitoring extract.
Cost Monitoring
Cost monitoring extract.
- Cost Management and Billing
Note: Cost management is covered in the FTA Governance Live session.
