Updating package-lock.json after upgrading modules and extension version |
||
|---|---|---|
| .github/workflows | ||
| .husky | ||
| fixtures | ||
| images | ||
| simulations | ||
| src | ||
| test | ||
| .babelrc | ||
| .editorconfig | ||
| .eslintrc.json | ||
| .gitignore | ||
| .jsdoc.json | ||
| .prettierrc | ||
| LICENSE | ||
| README.md | ||
| package-lock.json | ||
| package.json | ||
| tsconfig.json | ||
README.md
Audion: Web Audio Graph Visualizer
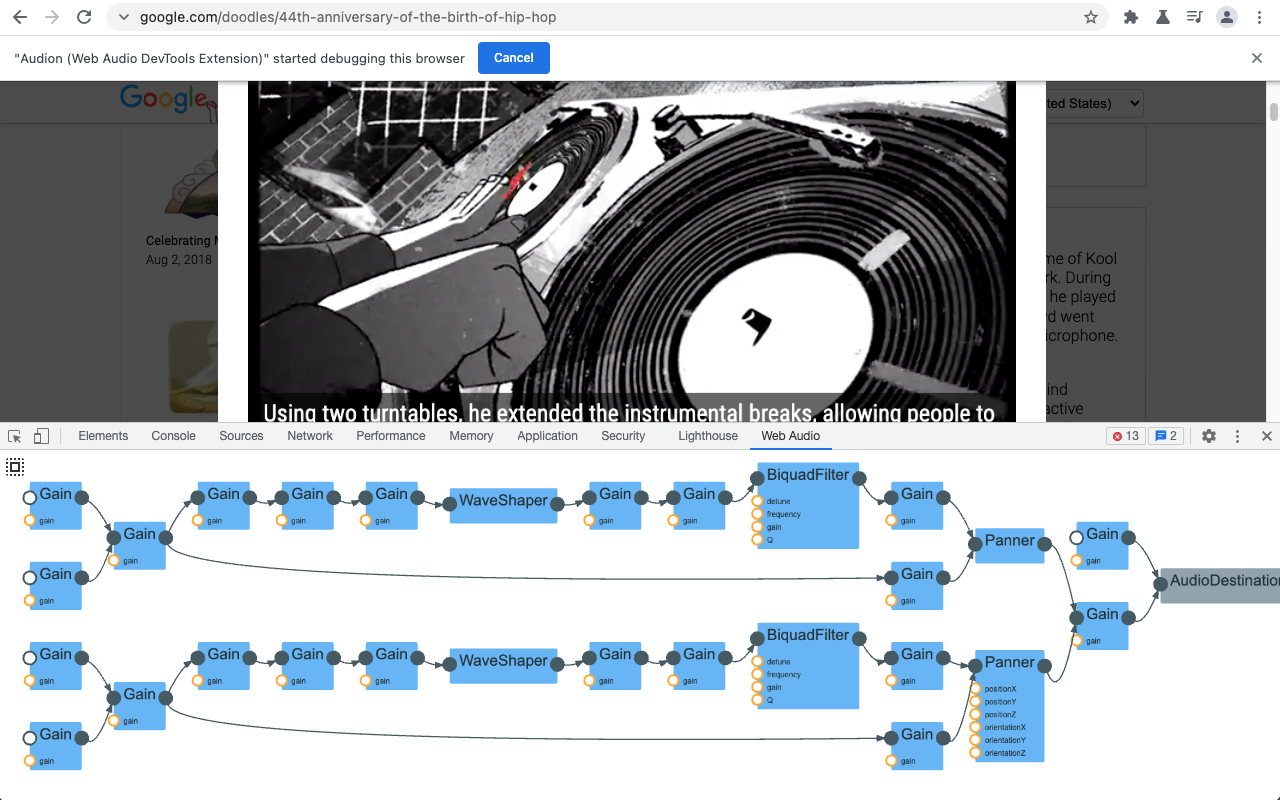
Audion is a Chrome extension that adds a panel to DevTools. This panel visualizes the audio graph (programmed with Web Audio API) in real-time. Soon you will be able to install the extension from Chrome Web Store page.
Usage
- Install the extension
from Chrome Web Store.
- Alternatively, you can clone this repository and build the extension locally. Follow this instruction to load the local build.
- Open Chrome Developer Tools. You should be able to find “Web Audio” panel in the top. Select the panel.
- Visit or reload a page that uses Web Audio API. If the page is loaded before opening Developer Tools, you need to reload the page for the extension to work correctly.
- You can pan and zoom with the mouse and wheel. Click the “autofit” button to fit the graph within the panel.
Development
Build and test the extension
- Install NodeJS 14 or later.
- Install dependencies with
npm ciornpm install. - Run
npm testto build and test the extension.
Install the development copy of the extension
- Open
chrome://extensionsin Chrome. - Turn on
Developer modeif it is not already active. - Load an unpacked extension with the
Load unpackedbutton. In the file modal that opens, select theaudiondirectory inside of thebuilddirectory under the copy of this repository.
Use and make changes to the extension
- Open the added
Web Audiopanel in an inspector window with a page that uses Web Audio API. - Make changes to the extension and rebuild with
npm testornpm run build. - Open
chrome://extensions, clickUpdateto reload the rebuilt extension. Close and reopen any tab and inspector to get the rebuilt extension's panel.
Use extra debugging information
- Open the extension option panel and check "Click here to show more debug info".
- Right click the visualizer panel and click "Inspect" to the extension's DevTools panel, and see the console for the extra debugging information.
Acknowledgments
Special thanks to Chi Zeng (Google), Gaoping Huang, Michael "Z" Goddard (Bocoup) and Tenghui Zhang for their contribution on this project.
Contribution
If you have found an error in this library, please file an issue at: https://github.com/GoogleChrome/audion/issues.
Patches are encouraged, and may be submitted by forking this project and submitting a pull request through GitHub. See CONTRIBUTING for more detail.
License
Copyright 2021 Google Inc. All Rights Reserved.
Licensed under the Apache License, Version 2.0 (the "License"); you may not use this file except in compliance with the License. You may obtain a copy of the License at
http://www.apache.org/licenses/LICENSE-2.0
Unless required by applicable law or agreed to in writing, software distributed under the License is distributed on an "AS IS" BASIS, WITHOUT WARRANTIES OR CONDITIONS OF ANY KIND, either express or implied. See the License for the specific language governing permissions and limitations under the License.
