4.1 KiB
{{+bindTo:partials.standard_devtools_article}}
Sample Debugging Protocol Clients
There are a number third-party clients for the Chrome debugging protocol. This section presents a sample.
Brackets
Brackets is a web-based IDE that uses the Chrome debugging protocol to enable
debugging and live HTML/CSS development.

More information:
- Official site.
- This blog post from Mark DuBois gives an overview of working in Brackets.
- Download from download.brackets.io.
- Source code available on GitHub.
Light Table
Light Table is a new IDE that takes a novel approach to arranging the developer's workspace. Light Table is currently in alpha. It's not open source, but the alpha version is available for free at this time.

More information:
- Read the blog post describing new features in 0.4.0, including DevTools integration.
- Download from the official site.
NodeJS
A number of modules have been developed to make use of the Chrome debugger from Node scripts.
chrome-remote-interface
The chrome-remote-interface module wraps the debugger protocol with a Node-style
JavaScript API.

More information:
-
Install using
npm:npm install -g chrome-remote-interface -
Source code available on GitHub.
crconsole
The crconsole module provides a command-line interface to the Chrome console. It
uses the chrome-remote-interface module to communicate with the Chrome debugger
protocol.
More information:
-
Install using
npm:npm install -g crconsole -
Source code available on GitHub.
Sublime Text
The Sublime Web Inspector project adds Chrome debugger integration to the popular Sublime Text editor. You can install it from the Sublime Text package manager.

More information:
- See the official page for an overview and installation instructions.
- Source code available on GitHub.
Telemetry
Telemetry is a performance testing framework used by the Chromium project to test multiple versions of the Chrome browser. It uses the debugging protocol to remotely control instances of Chrome.
More information:
Vim
Chrome.vim is an experimental plugin for the Vim editor that provides some basic Chrome operations as Vim commands.
More information:
WebDriver
The Selenium browser automation tools use WebDriver API to abstract interactions with different browsers. The WebDriver implementation for Chrome uses the Chrome debugging protocol.
More information:
If you know of more, please let us know using the Feedback tool at the top right of this page!
WebStorm
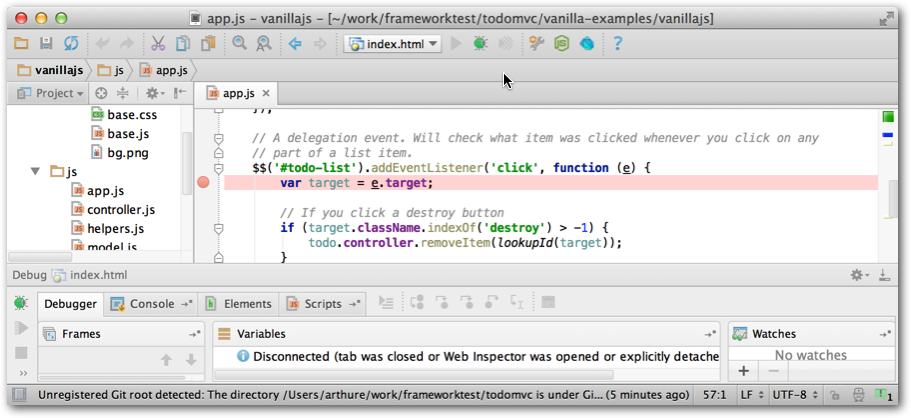
WebStorm is a commercial IDE that supports debugging and live-editing in Chrome. WebStorm uses a Chrome extension to integrate with the Chrome debugger.

More information:
- Download from JetBrains.
- Screencast describing the latest debugging features.
{{/partials.standard_devtools_article}}