README.md
K2Bridge
K2Bridge is a solution that enables Kibana to use Azure Data Explorer (ADX, or codename Kusto) as its backend database.
| ⚡ Breaking change notice ! |
|---|
This is a new version that adds support for visualization and for Kibana 7. To avoid a breaking change, we are changing the way we tag our images. The new images tags are: 6.8_latest and 7.16_latest, support Kibana 6.8 and Kibana 7.10 respectively. The image of '7.16_latest' supports Kibana OSS 7.10.2, and its internal Elasticsearch instance is 7.16.2. Action item: Use the provided helm chart to update the deployment with the new image tags.
Description
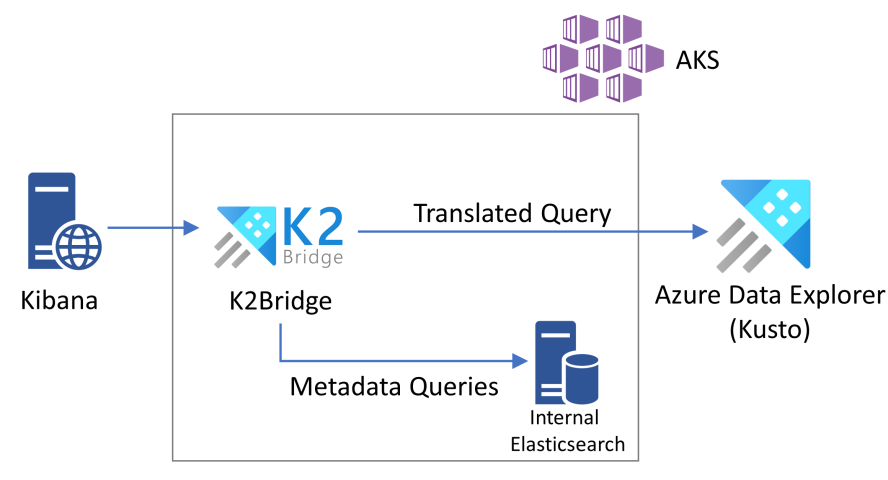
The K2Bridge solution is a proxy capable of communicating with the Kibana application and translate its queries to KQL, the query language of the Azure Data Explorer service. The solution currently targets the "Discover", "Visualzie" and "Dashboard" tabs in Kibana to enable users to quickly and interactively explore their data. It supports the filters and well as the search box in the screen with both simple term search and Lucene expressions.
How does it work
The K2Bridge is the endpoint exposed to clients and the one Kibana connects to. Internally, a small elasticsearch is being used to service metadata related requests (index-patterns, saved queries etc.). Note that no business data is actually saved in this internal instance and it can be considered as an implementation detail (could be removed in the future). The bridge accept each request and redirects business (data) requests to ADX and metadata requests to the metadata store.
Some differences to be aware of
-
The searching documentation provides insights to the similarities and differences between Elasticsearch and ADX as Kibana data sources.
-
Each document in Elasticsearch has a unique id usually noted in the "_id" field. This isn't inherently available for data stored in ADX and because Kibana expects it, K2Bridge generates a random number for this value. Please note that this is not a reproducible value and you shouldn't search for documents/items that have specific values.
-
We have used and tested the solution using Kibana OSS 7.10.2.
Installing
K2Bridge deploys to Kubernetes. Instructions are available here.
Connecting data
The application settings contains the credentials for a service principal, a
reference to an ADX cluster and a default database within the cluster (adxDefaultDatabaseName).
The application surfaces the following data from ADX as indexes into Kibana:
- Tables located in any database on the ADX cluster, regardless of the
adxDefaultDatabaseNamesetting, provided the service principal has Viewer permissions on the table. - Functions located in the
adxDefaultDatabaseNamedatabase only, provided:- The service principal has Viewer permissions on the function.
- The function does not take any parameters.
ADX functions without parameters are similar in nature to views in relational databases. Through functions, you can perform preform calculations, joins as well as cross-database and cross-cluster queries and queries into Azure Monitor (Application Insights and Log Analytics), provided the service principal has adequate permissions on the external resources. For example:
.create function MyAzureMonitorConnectionFunction() {
    cluster('https://ade.loganalytics.io/subscriptions/<subscription-id>/resourceGroups/<resource-group-name>/providers/Microsoft.OperationalInsights/workspaces/<workspace-name>')
    .database('<workspace-name>')
    .['<tablename>']
}
Make sure you grant access to the service principal (that you created as part of the installation requirements) from your Log Analytics workspaces. To do so, go to your Log Analytics resource on the Azure portal, click on Access Control (IAM) and then Add. Click "Add role assignment", set the Role to Reader, and select the service principal created earlier.
Be mindful of the performance impact of such distributed queries, which can easily result into Kibana timeouts.
Prometheus Support
K2Bridge supports the Prometheus protocol for metrics reporting (like request time, query time and payload size). Supported exposition formats are the 0.0.4 text and protocol buffer formats.
More on the formats can be found at the Prometheus documentations.
K2Bridge would reply based on the content type header, so pointing your browser to:
http://bridge-host/metrics/ will return a text representation of the metrics with their documentation.
Performance
You can find more about the performance test and capabilities in the Performance page.
Developing
Information on how to run Kibana and K2Bridge locally for development and testing can be found here.
Data Collection
The software may collect information about you and your use of the software and send it to Microsoft. Microsoft may use this information to provide services and improve our products and services. You may turn off the telemetry as described in the repository. There are also some features in the software that may enable you and Microsoft to collect data from users of your applications. If you use these features, you must comply with applicable law, including providing appropriate notices to users of your applications together with a copy of Microsoft's privacy statement. Our privacy statement is located at https://go.microsoft.com/fwlink/?LinkID=824704. You can learn more about data collection and use in the help documentation and our privacy statement. Your use of the software operates as your consent to these practices.
Data collection may be disabled by installing the K2 helm chart by setting the collectTelemetry field to false. e.g: '--set settings.collectTelemetry=false'
Attribution
Elasticsearch is a trademark of Elasticsearch BV, registered in the U.S. and in other countries. Kibana is a trademark of Elasticsearch BV, registered in the U.S. and in other countries.
Contributing
This project welcomes contributions and suggestions. Most contributions require you to agree to a Contributor License Agreement (CLA) declaring that you have the right to, and actually do, grant us the rights to use your contribution. For details, visit https://cla.opensource.microsoft.com.
When you submit a pull request, a CLA bot will automatically determine whether you need to provide a CLA and decorate the PR appropriately (e.g., status check, comment). Simply follow the instructions provided by the bot. You will only need to do this once across all repos using our CLA.
This project has adopted the Microsoft Open Source Code of Conduct. For more information see the Code of Conduct FAQ or contact opencode@microsoft.com with any additional questions or comments.

