This pr is auto merged as it contains a mandatory file and is opened for more than 10 days. |
||
|---|---|---|
| data_analysis | ||
| public | ||
| src | ||
| .gitattributes | ||
| .gitignore | ||
| LICENSE | ||
| README.md | ||
| SECURITY.md | ||
| app.js | ||
| package.json | ||
| participantList.js | ||
| screenshots.png | ||
| web.config | ||
| webpack.config.js | ||
README.md
A Comparative Evaluation of Animation and Small Multiples For Trend Visualization on Mobile Phones
This repository contains supplemental material for a research paper A Comparative Evaluation of Animation and Small Multiples For Trend Visualization on Mobile Phones by Matthew Brehmer (Microsoft Research), Bongshin Lee (Microsoft Research), Petra Isenberg (Inria), and Eun Kyoung Choe (University of Maryland).
It contains including source code for software used in an experiment as well as experimental data and analysis scripts.

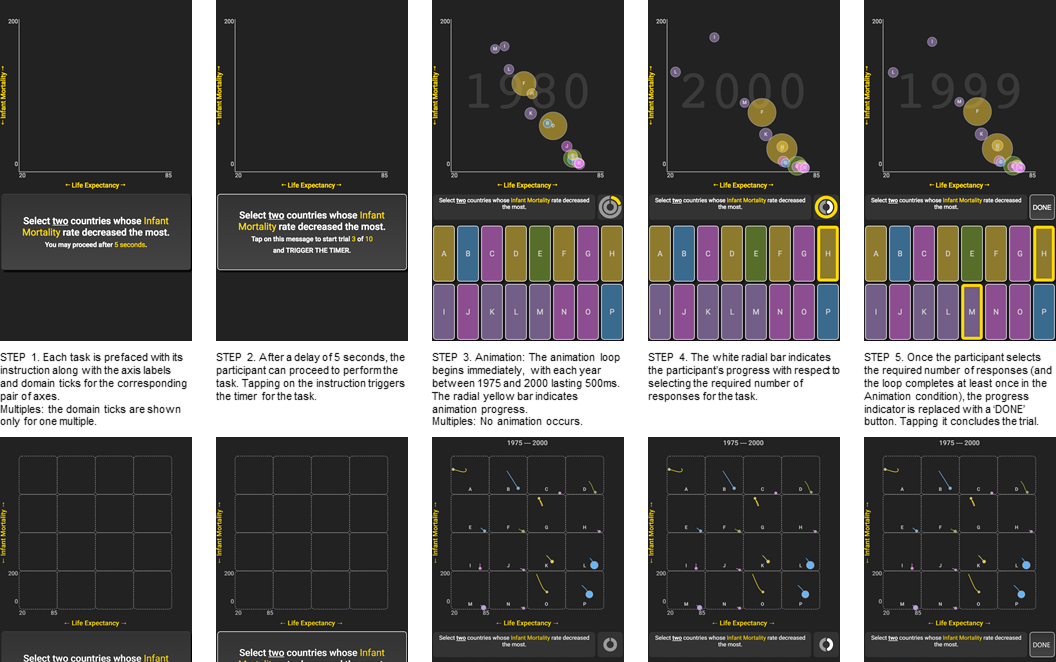
Figure: The five stages of a single task, as experienced in the Animation condition (top) and in the Multiples condition (bottom), comprised of a task instruction reading phase (Steps 1–2) and a task completion phase (Steps 3–5).
This repository is maintained by Matthew Brehmer.
Experiment Application Source Code
A mobile-only web application for evaluating animated and faceted versions of bubble charts.
An instance of the application is running at aka.ms/multiples, which can be viewed device running the Chrome or Safari mobile web browser.
Setup / Testing
-
Open a terminal and navigate to this directory
-
Ensure that nodejs is installed
-
Install the necessary packages with
npm install -
Start the node server with:
npm start -
Open localhost:8080 in Chrome. For emulating a mobile usage environment, launch the Chrome debugger (
CTRL + SHIFT + J) and toggle the device emulator (CTRL + SHIFT + M); select your desired mobile device. Note that the application will only be visible in portrait mode in the mobile emulator.
Icon Attribution
The application incorporates (and modifies) the following CC BY 3.0 icons from the Noun Project:
- Hand Holding Smartphone #1248199 by UNiCORN
- Portrait Orientation #456515 by Guilhem
- Phone Brightness #753458 by corpus delicti
- Brightness #662615 by Creaticca Creative Agency
- Wifi #688371 by Kid A
- Battery #1099945 by ProSymbols
- Back #1263570 by praveen patchu
- Refresh #1176415 by il Capitano
- Ban #46000 by useiconic.com
3rd party package dependencies
- d3 (BSD-3 license)
- d3-rect (BSD-3 license)
- clipboard (MIT license)
- csv-loader (MIT license)
- serve (MIT license)
- pre-loader (MIT license)
- socket.io (MIT license)
- socket.io-client (MIT license)
- webpack (MIT license)
- webpack-dev-server (MIT license)
- webpack-dev-middleware (MIT license)
- jshint (MIT license and JSON license)
- jshint-loader (MIT license)
- express (MIT license)
- concurrently (MIT license)
Contributing
This project welcomes contributions and suggestions. Most contributions require you to agree to a Contributor License Agreement (CLA) declaring that you have the right to, and actually do, grant us the rights to use your contribution. For details, visit https://cla.microsoft.com.
When you submit a pull request, a CLA-bot will automatically determine whether you need to provide a CLA and decorate the PR appropriately (e.g., label, comment). Simply follow the instructions provided by the bot. You will only need to do this once across all repos using our CLA.
This project has adopted the Microsoft Open Source Code of Conduct. For more information see the Code of Conduct FAQ or contact opencode@microsoft.com with any additional questions or comments.