* squashed linting fix (#93) Co-authored-by: Alexander Metzger <alexander@metzger.dk> * Enable unit-tests for PR (#99) * Microsoft mandatory file (#90) Co-authored-by: microsoft-github-policy-service[bot] <77245923+microsoft-github-policy-service[bot]@users.noreply.github.com> * Update build.yml * Update build.yml * squashed linting fix (#93) Co-authored-by: Alexander Metzger <alexander@metzger.dk> fixed unit tests fixed tests fixed lint fixed actions * fixed actions --------- Co-authored-by: microsoft-github-policy-service[bot] <77245923+microsoft-github-policy-service[bot]@users.noreply.github.com> Co-authored-by: Alexander Metzger <97496861+SanderGi@users.noreply.github.com> * Accessibility (#95) * squashed accessibility * fixed tests * package fixes * test * add tab back in * revert unecessary changes * remove support for old browsers --------- Co-authored-by: Alexander Metzger <alexander@metzger.dk> * Sunburst update (#117) * Update dependencies * Update formatting settings * Return code affecting the color * Update readme, build, codeql, split dependencies * Change styles for keyboard nav * Use selectionManager instead of interactivityUtils * Add styles for legend * Fix category label * Fix stroke width for keyboard navigation * Add tests for selection and keyboard navigation * Behavior refactoring * Make category label fit into inner circle * Increment version * Remove stylelint * Add tests for labels --------- Co-authored-by: Iuliia Kulagina <v-ikulagina@microsoft.com> * Add localization keys (#118) Co-authored-by: Iuliia Kulagina <v-ikulagina@microsoft.com> * New translations (#125) * Add interactivity to the legend, add styles for percentage label (#119) * Add styles for percentage label * Add interactivity to legend * Fix audit vulnerabilities, update API, increment visual version * Rise minor version * Fix isHighContrast param name * Add styles for central label * Fix object name in tests * Fix capabilities * Change to default sorting and fix colors * Fix tests * Add report page tooltip * Update powerbi-visuals-utils * Fix npm audit vulnerability * Add limitation for indentation, remove unused method * Rerfactor behavior * Refactor base font class * Fix tests * Fix npm vulnerabilities --------- Co-authored-by: Iuliia Kulagina <v-ikulagina@microsoft.com> Co-authored-by: Alexey <39551830+Demonkratiy@users.noreply.github.com> * New translations (#128) --------- Co-authored-by: Alexander Metzger <97496861+SanderGi@users.noreply.github.com> Co-authored-by: Alexander Metzger <alexander@metzger.dk> Co-authored-by: Nikita Grachev <v-grniki@microsoft.com> Co-authored-by: microsoft-github-policy-service[bot] <77245923+microsoft-github-policy-service[bot]@users.noreply.github.com> Co-authored-by: Iuliia Kulagina <86924383+kullJul@users.noreply.github.com> Co-authored-by: Iuliia Kulagina <v-ikulagina@microsoft.com> Co-authored-by: pbicvloc <104190707+pbicvloc@users.noreply.github.com> |
||
|---|---|---|
| .github/workflows | ||
| .vscode | ||
| assets | ||
| src | ||
| stringResources | ||
| style | ||
| test | ||
| .editorconfig | ||
| .eslintignore | ||
| .eslintrc.js | ||
| .gitignore | ||
| .stylelintrc | ||
| CHANGELOG.md | ||
| LICENSE | ||
| README.md | ||
| SECURITY.md | ||
| capabilities.json | ||
| karma.conf.ts | ||
| package-lock.json | ||
| package.json | ||
| pbiviz.json | ||
| test.tsconfig.json | ||
| test.webpack.config.js | ||
| tsconfig.json | ||
README.md
powerbi-visuals-sunburst
Sunburst is a multilevel donut chart, used to visualize hierarchical data, depicted by concentric circles.
Overview
Sunburst chart is used to visualize hierarchical data, depicted by concentric circles. The circle in the centre represents the root node, with the hierarchy moving outward from the center. A segment of the inner circle bears a hierarchical relationship to those segments of the outer circle which lie within the angular sweep of the parent segment.
See also Sunburst chart at Microsoft Office store
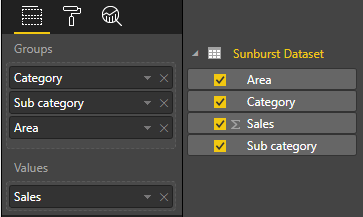
Sunburst has 2 bucket fields: Category, Values.
- Category - Field with a list of categories for each circle segment. It can accept many values.
- Values - Field with values for Category field. It can accept one value. Also this field is used for cross filtering with other visuals.
Selection
You can select any segment of the chart for data filtering. For cleaning of selection you should click outside to "Сlear" button on the right top corner of a visual.
Settings of Sunburst
Group
-
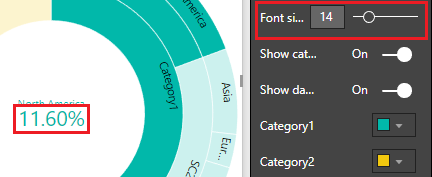
Font size: size of the label in the center of sunburst (see screenshot):
-
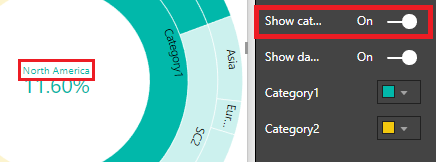
Show category label: show category label in the center of the visual
-
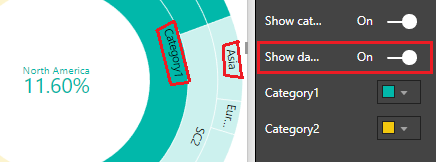
Show data labels: show text labels inside of arc segments of Sunburst
-
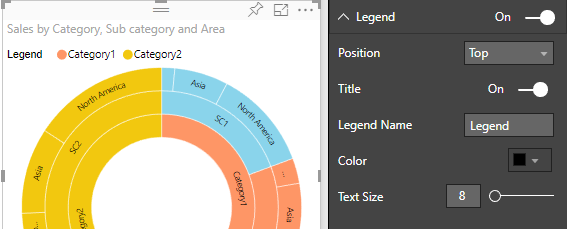
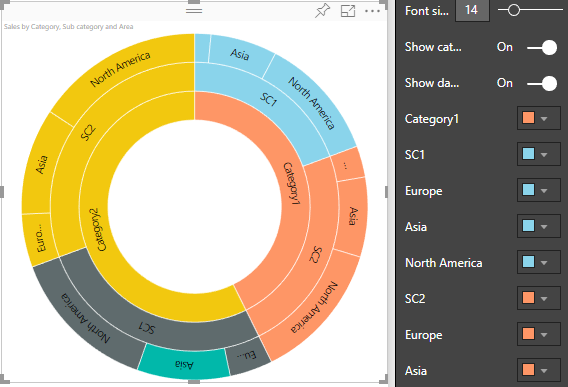
Category colors: to change colors of each category of the visual. Changing element color will also change its child elements color, but if you changed child element color before then it'll keep unchanged.
Tooltip
- Display Units: tooltip numeric value format. Possible values: Auto, Thousands, Million, Billions, Trillions.
- Decimal places: amount of decimal places to show.


