This pr is auto merged as it contains a mandatory file and is opened for more than 10 days. |
||
|---|---|---|
| SampleRVisualisationDashboard | ||
| .gitignore | ||
| DemoScreenshot.png | ||
| LICENSE | ||
| README.md | ||
| SECURITY.md | ||
| WorkingWithROnSqlAzureData.sln | ||
README.md
Overview
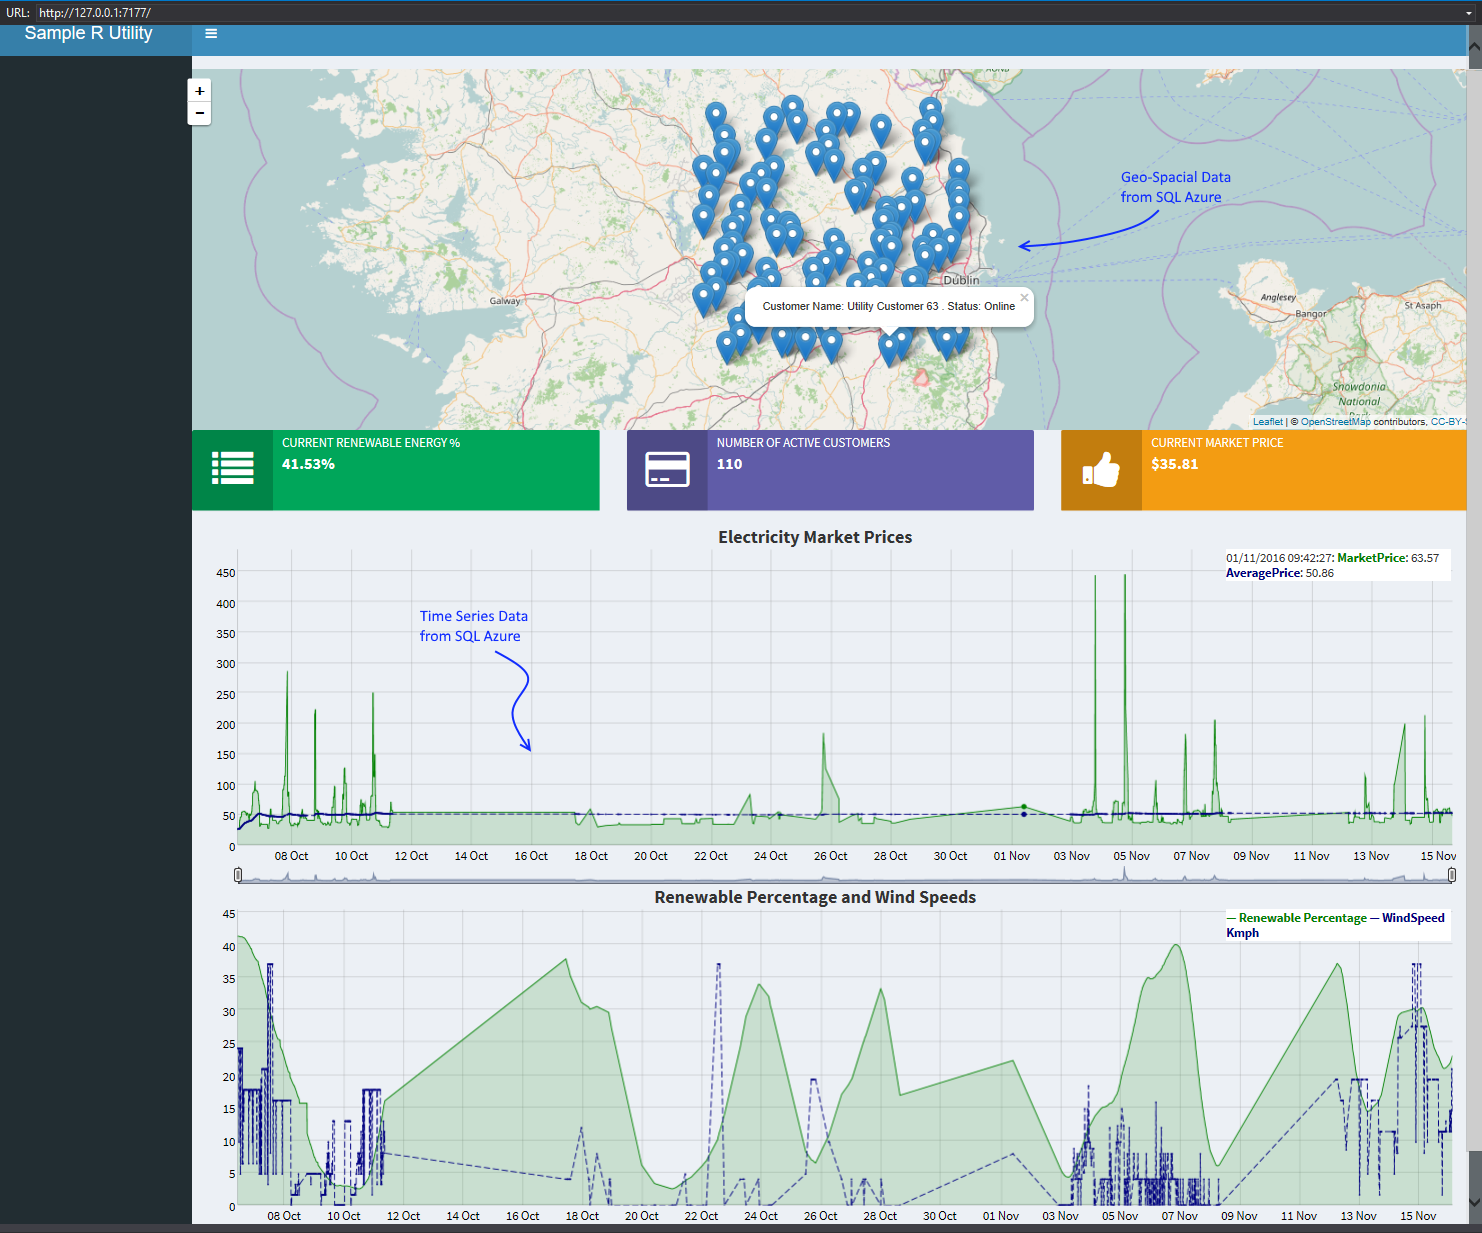
This is a sample R ShinyApp application which shows how to query data from a SQL Azure database in the Microsoft Azure cloud and visualise that data, which contains geospacial coordinates, onto a World Map.
Usage Guide
- Clone the repository to your local machine
- Create or open your Microsoft Azure account
- Restore the sample Sql Azure Database File in the SampleSqlAzureDatabaseFile folder to a SQL Azure Server in your Azure Subscription. If you don't have a SQL Azure Server yet, create one as per https://docs.microsoft.com/en-us/azure/sql-database/sql-database-get-started
- Update the connection settings in your copy of the solution to replace YourSqlAzureDatabaseHere with the name of your SQL Azure Server and database name you just restored
- Run the solution locally with the "local" connection string uncommented. The solution will launch a ShinyApp application which connects to your SQL Azure database and visualise the geo-spacial data in the SQL Azure database to a world map, and dynamic charts
- To deploy the application to ShinyApps.io, uncomment the connection string commented as "Uncomment this line when deploying to Shiny" and publish.
- Customise as you see fit!
Contributing
This project has adopted the Microsoft Open Source Code of Conduct. For more information see the Code of Conduct FAQ or contact opencode@microsoft.com with any additional questions or comments.
