|
|
||
|---|---|---|
| src | ||
| .gitignore | ||
| .npmignore | ||
| CODE_OF_CONDUCT.md | ||
| LICENSE | ||
| README.md | ||
| SECURITY.md | ||
| demo.js | ||
| example.dot | ||
| example.png | ||
| package-lock.json | ||
| package.json | ||
| tsconfig.json | ||
README.md
vscode-cdp-proxy
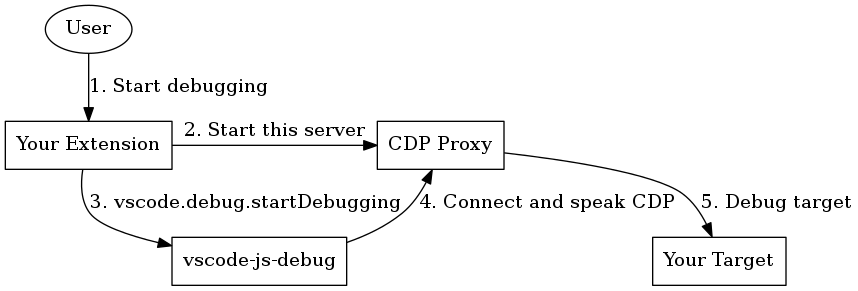
Sample Chrome Debug Protocol proxy used to extend vscode-js-debug with custom targets. This can be used to allow js-debug to work with esoteric targets, like WebAssembly-compiled and frameworks like React Native. Say you're building a React Native debugger. The general flow would work like so:
-
You have a React Native extension, which allows users to start debugging via a command or a launch config.
-
When a session starts, you start a CDP proxy, like the one in this repo. Say it starts listening on
localhost:3000 -
Then, you call
vscode.debug.startDebuggerwith a configuration like:{ "type": "pwa-chrome", "request": "attach", "address": "localhost", // <- host your proxy is running on "port": 3000, // <- port your proxy is running on } -
The debugger will then connect to the proxy like it would any other CDP-enabled target.
-
Finally, you translate between CDP and the protocol used to debug your target application. In the case of React Native, this is might be a minimal rewrite of some CDP behavior. In the case of more advanced WebAssembly targets, you might translate into something entirely new.
Using this Package
Parts of this package are exported from js-debug. We may publish these parts as nicely packaged bits for reuse here and in the extension, but that's not done right now.
Check out demo.js for an example of a server.
