8.9 KiB
CMake: Debug and launch
CMake Tools makes it easier to set up debugging. Because C and C++ projects may define multiple (sometimes dozens or even hundreds) of executables, creating a launch.json may be difficult.
If you define any executable targets via CMake, CMake Tools will be aware of them and allow you to start debugging them.
Note: Debugging is supported when CMake is using either CMake Server or the cmake-file-api. These modes are enabled automatically for CMake versions 3.7.2 and above. Debugging is not available on older versions.
If you are running an older version of CMake and want to use target debugging, update your CMake version to version 3.7.2 or higher.
By default, launching or debugging an executable target causes it to be built first. This can be disabled with the cmake.buildBeforeRun setting.
Select a launch target
The first time you run target debugging, CMake Tools asks for you to specify a target, which will be persisted between sessions.
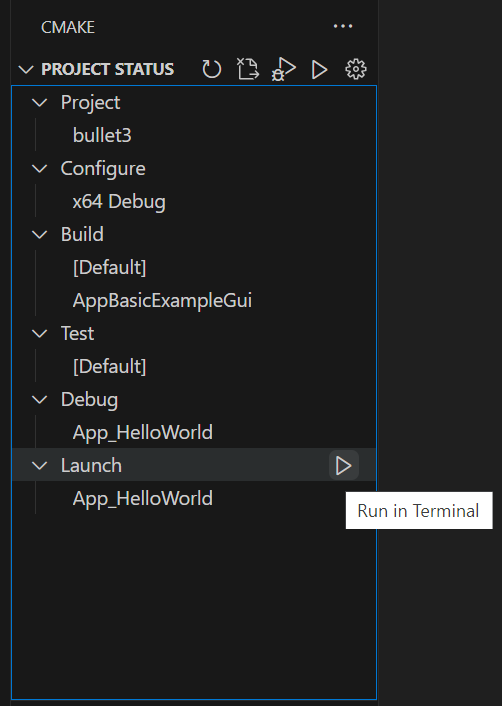
The active launch target is shown in the CMake Tools sidebar Project Status View under the Launch node:
Selecting the active launch target button will show the launch target selector so that you can change the active launch target.
From there, you can press the play button by the Launch node to run it in terminal.
Debugging without a launch.json
CMake Tools lets you start a debugger on a target without creating a launch.json.
Note: Only the debugger from Microsoft's
vscode-ms-vscode.cpptoolsextension supports quick-debugging. See Debug using a launch.json file, below, for information aboutlaunch.jsonand using other debuggers.
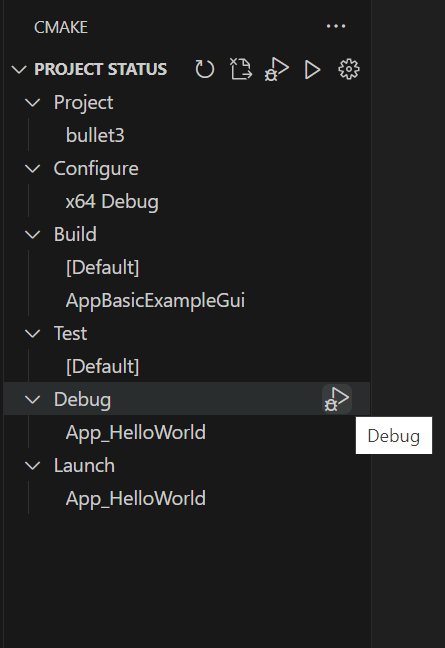
Start a debugging session on the active target by running the CMake: Debug command from the VS Code command palette, by selecting the Debug button in the status bar or CMake Tools sidebar Project Status View, or by pressing the keyboard shortcut (the default is Ctrl+F5).
Note: Quick-debugging does not let you specify program arguments or other debugging options. See the next section for more options.
Debug using a launch.json file
You can specify the working directory or command line arguments for debugging, or use another debugger than the one included with Microsoft's vscode-ms-vscode.cpptools, by creating a launch.json file.
You'll need to know the path to the executable binary, which may be difficult to know in advance. CMake Tools can help by using command substitution in the launch.json file. This is already used by things like process selection when attaching to a running process. It works by specifying a command-based substitution in the appropriate field of launch.json.
Here are minimal examples of a launch.json file that uses cmake.launchTargetPath and cmake.getLaunchTargetDirectory to start a debugger on the active launch target:
gdb
{
    "version": "0.2.0",
    "configurations": [
        {
            "name": "(gdb) Launch",
            "type": "cppdbg",
            "request": "launch",
            // Resolved by CMake Tools:
            "program": "${command:cmake.launchTargetPath}",
            "args": [],
            "stopAtEntry": false,
            "cwd": "${workspaceFolder}",
            "environment": [
                {
                    // add the directory where our target was built to the PATHs
                    // it gets resolved by CMake Tools:
                    "name": "PATH",
                    "value": "${env:PATH}:${command:cmake.getLaunchTargetDirectory}"
                },
                {
                    "name": "OTHER_VALUE",
                    "value": "Something something"
                }
            ],
            "externalConsole": true,
            "MIMode": "gdb",
            "setupCommands": [
                {
                    "description": "Enable pretty-printing for gdb",
                    "text": "-enable-pretty-printing",
                    "ignoreFailures": true
                }
            ]
        }
    ]
}
lldb
{
    "version": "0.2.0",
    "configurations": [
        {
            "name": "(lldb) Launch",
            "type": "cppdbg",
            "request": "launch",
            // Resolved by CMake Tools:
            "program": "${command:cmake.launchTargetPath}",
            "args": [],
            "stopAtEntry": false,
            "cwd": "${workspaceFolder}",
            "environment": [
                {
                    // add the directory where our target was built to the PATHs
                    // it gets resolved by CMake Tools:
                    "name": "PATH",
                    "value": "${env:PATH}:${command:cmake.getLaunchTargetDirectory}"
                },
                {
                    "name": "OTHER_VALUE",
                    "value": "Something something"
                }
            ],
            "externalConsole": true,
            "MIMode": "lldb"
        }
    ]
}
msvc
{
    "version": "0.2.0",
    "configurations": [
        {
            "name": "(msvc) Launch",
            "type": "cppvsdbg",
            "request": "launch",
            // Resolved by CMake Tools:
            "program": "${command:cmake.launchTargetPath}",
            "args": [],
            "stopAtEntry": false,
            "cwd": "${workspaceFolder}",
            "environment": [
                {
                    // add the directory where our target was built to the PATHs
                    // it gets resolved by CMake Tools:
                    "name": "PATH",
                    "value": "${env:PATH}:${command:cmake.getLaunchTargetDirectory}"
                },
                {
                    "name": "OTHER_VALUE",
                    "value": "Something something"
                }
            ],
            "externalConsole": true
        }
    ]
}
ctest
{
    "version": "0.2.0",
    "configurations": [
        {
            "name": "(ctest) Launch",
            "type": "cppvsdbg",
            "request": "launch",
            // Resolved by CMake Tools:
            "program": "${command:cmake.launchTargetPath}",
            "args": [],
            "stopAtEntry": false,
            "cwd": "${workspaceFolder}",
            "environment": [
                {
                    // add the directory where our target was built to the PATHs
                    // it gets resolved by CMake Tools:
                    "name": "PATH",
                    "value": "${env:PATH}:${command:cmake.getLaunchTargetDirectory}"
                },
                {
                    "name": "OTHER_VALUE",
                    "value": "Something something"
                }
            ],
            "externalConsole": true
        }
    ]
}
The value of the program attribute is expanded by CMake Tools to be the absolute path of the program to run.
Note: You must successfully configure before
cmake.launchTargetPathandcmake.getLaunchTargetDirectorywill resolve correctly.
Debugging tests
You can also construct launch.json configurations that allow you to debug tests in the Test Explorer.
Note: These launch.json configurations are to be used specifically from the UI of the Test Explorer.
The easiest way to do this is to construct the debug configuration using cmake.testProgram for the program field, cmake.testArgs for
the args field, and cmake.testWorkingDirectory for the cwd field.
A couple of examples:
gdb
{
    "name": "(ctest) Launch",
    "type": "cppdbg",
    "request": "launch",
    // Resolved by CMake Tools:
    "cwd": "${cmake.testWorkingDirectory}",
    "program": "${cmake.testProgram}",
    "args": [ "${cmake.testArgs}"],
}
msvc
{
    "name": "(ctest) Launch",
    "type": "cppvsdbg",
    "request": "launch",
    // Resolved by CMake Tools:
    "program": "${cmake.testProgram}",
    "args": [ "${cmake.testArgs}"],
}
Depending on your configuration or your settings, there may need to be additional configuration options set.
Run without debugging
You can run a target without debugging it, by running the CMake: Run Without Debugging from VS Code's command palette, by selecting the play button in the status bar or the play button to the left of the Launch node, or by pressing the keyboard shortcut (the default Shift+F5).
The output of the target will be shown in an integrated terminal.
Next steps
- See how to troubleshoot CMake Tools
- Explore the CMake Tools documentation


