4.3 KiB
Electron debugging (main and renderer process)
This recipe shows how to use the built-in JavaScript deubgger in VS Code to debug Electron applications.
Electron applications can consist of two process types: a main process type running in NodeJS, and a renderer process type in Chromium. This means that you'll need to use two debugger instances within VS Code to debug both processes.
Note: Please make sure you are using Electron 1.7.4 or newer, as our debuggers rely on the inspector protocol.
Getting Started
-
Make sure you're running the latest version of VS Code.
-
This guide assumes that you are using the electron-quick-start project. Clone the repo to get started:
git clone https://github.com/electron/electron-quick-start.git
cd electron-quick-start
npm install
code .
Configure launch.json File
-
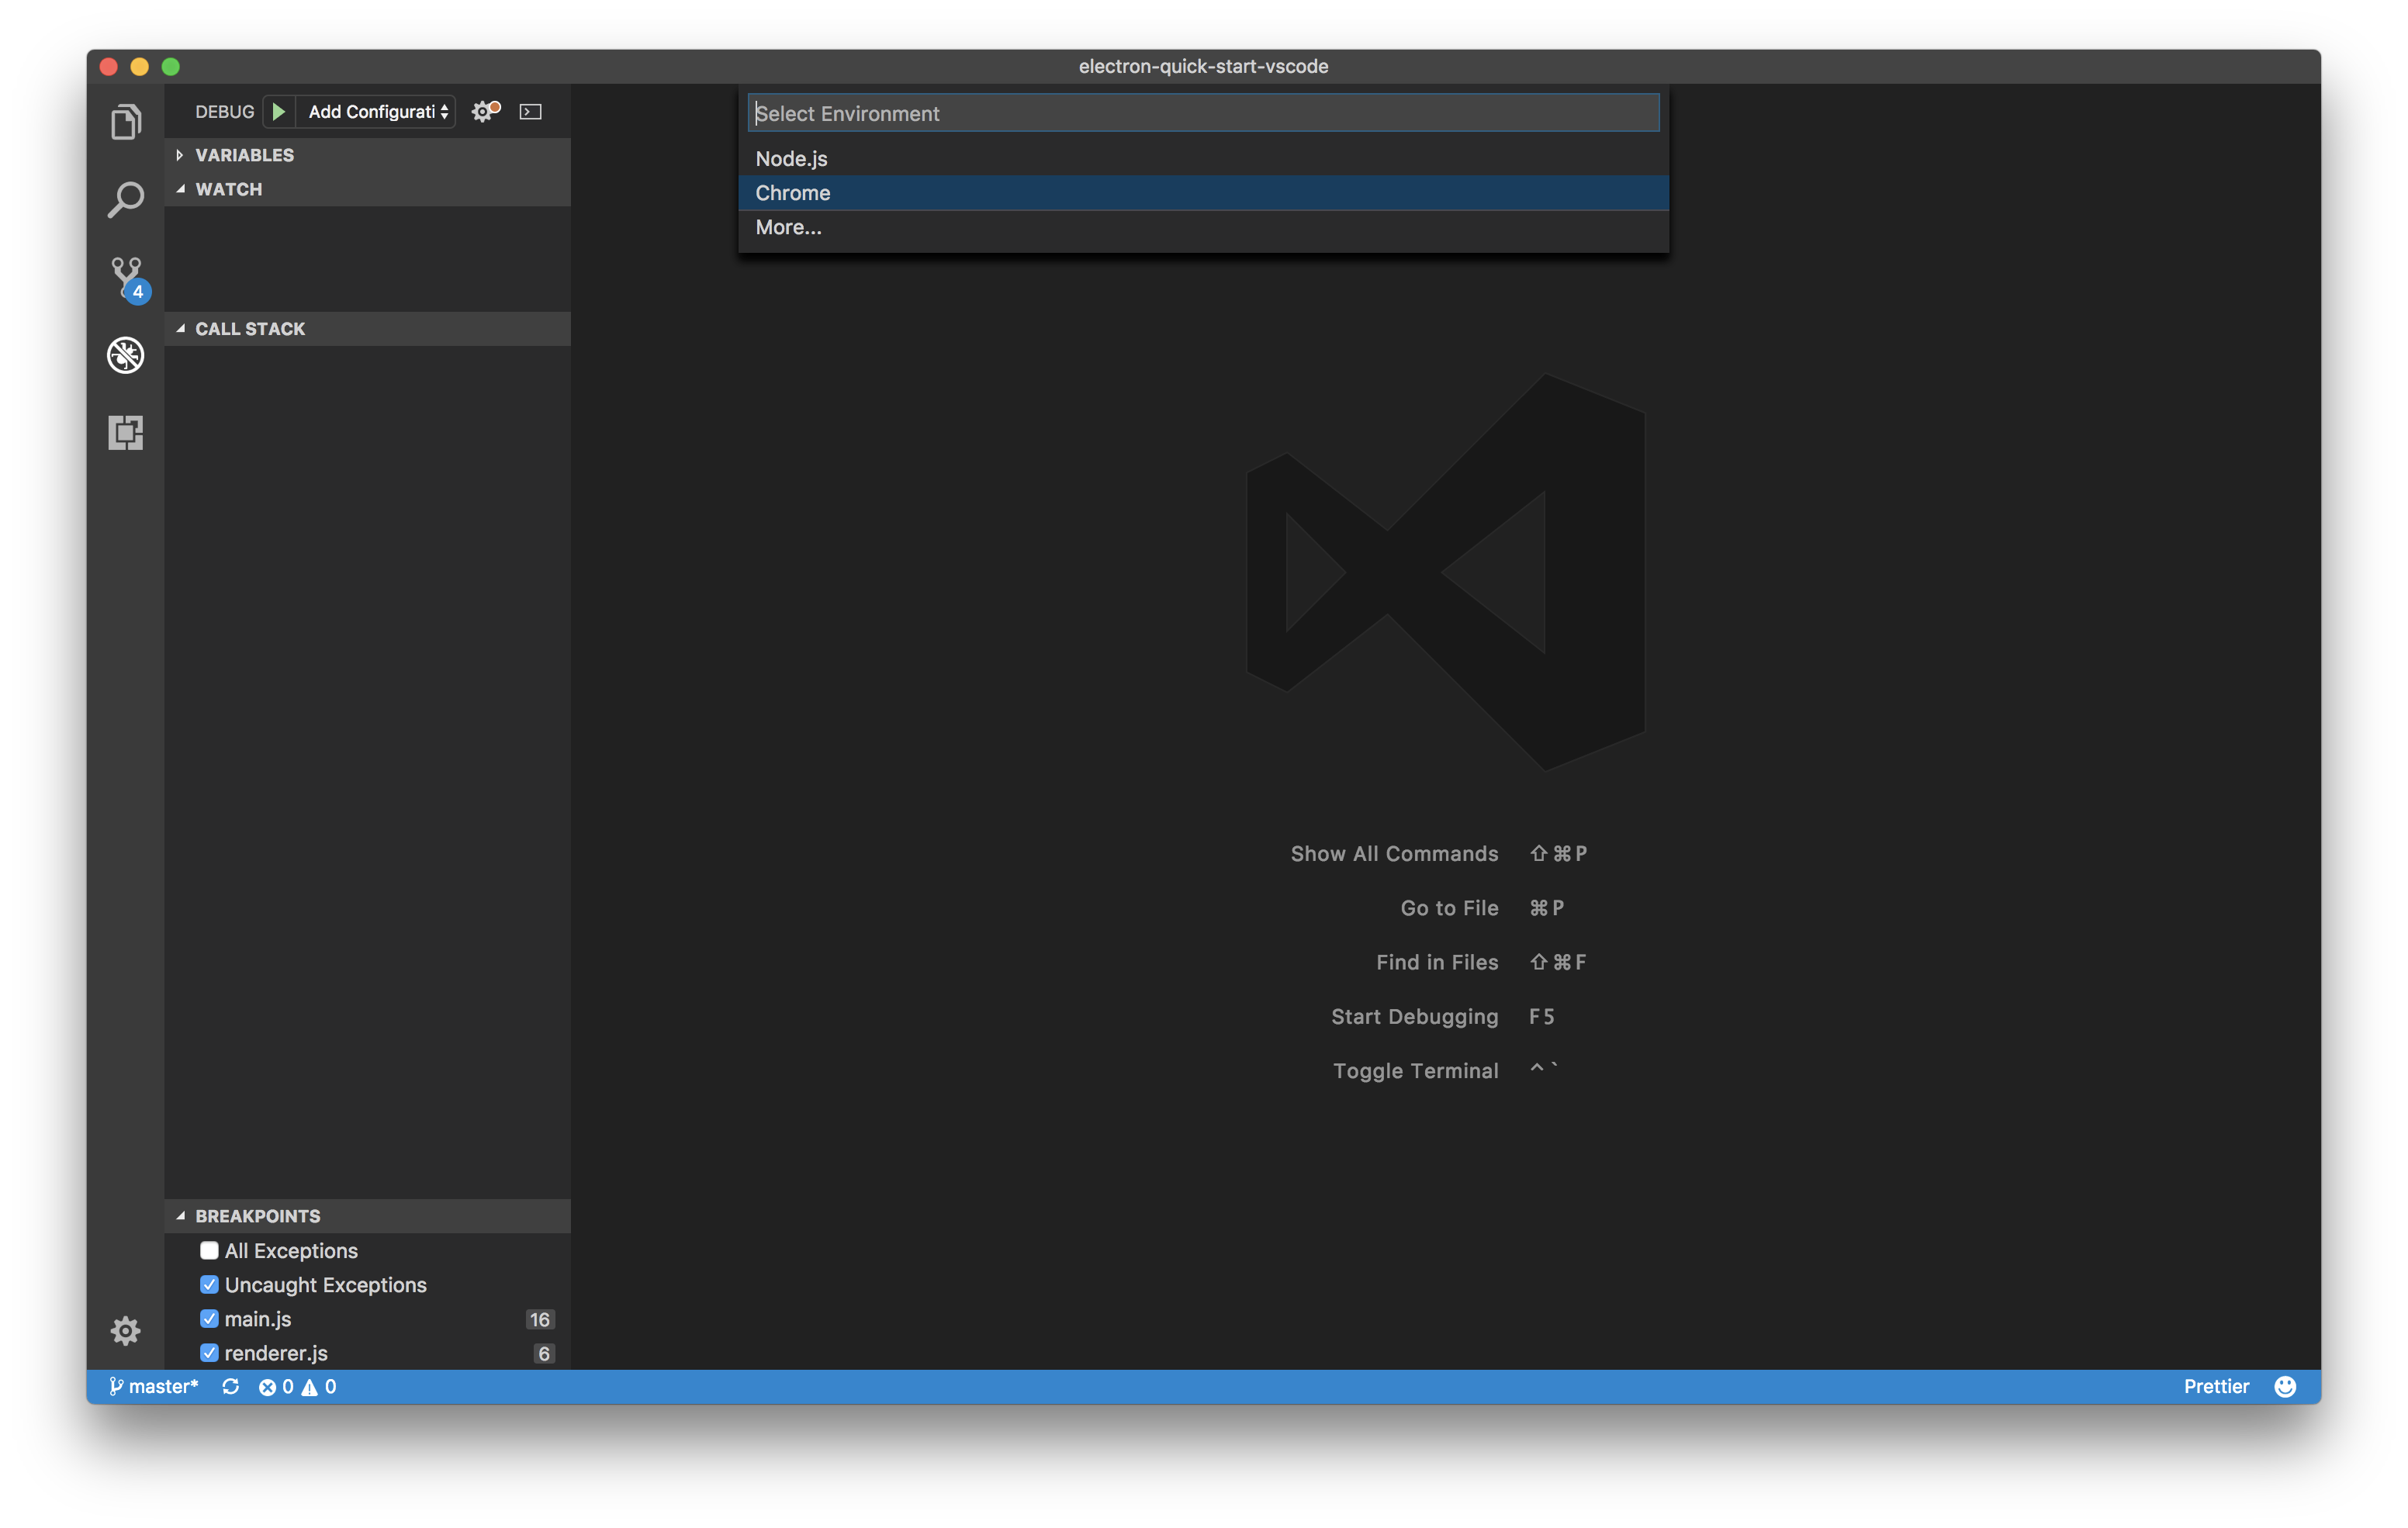
Click on the Debugging icon in the Activity Bar (or press Cmd/Ctrl+Shift+D) to bring up the Debug view. Then click on the gear icon to configure a launch.json file, selecting Chrome for the environment:
-
Replace content of the generated launch.json with the following two configurations:
  {
      "version": "0.2.0",
      "configurations": [
          {
              "type": "node",
              "request": "launch",
              "name": "Electron: Main",
              "runtimeExecutable": "${workspaceFolder}/node_modules/.bin/electron",
              "runtimeArgs": [
                  "--remote-debugging-port=9223",
                  "."
              ],
              "windows": {
                  "runtimeExecutable": "${workspaceFolder}/node_modules/.bin/electron.cmd"
              }
          },
          {
              "name": "Electron: Renderer",
              "type": "chrome",
              "request": "attach",
              "port": 9223,
              "webRoot": "${workspaceFolder}",
              "timeout": 30000
          }
      ],
      "compounds": [
          {
              "name": "Electron: All",
              "configurations": [
                  "Electron: Main",
                  "Electron: Renderer"
              ]
          }
      ]
  }
Debugging the Main Process
-
Set a breakpoint in main.js on
line 16within thecreateWindowfunction by clicking the gutter to the left of the line number. -
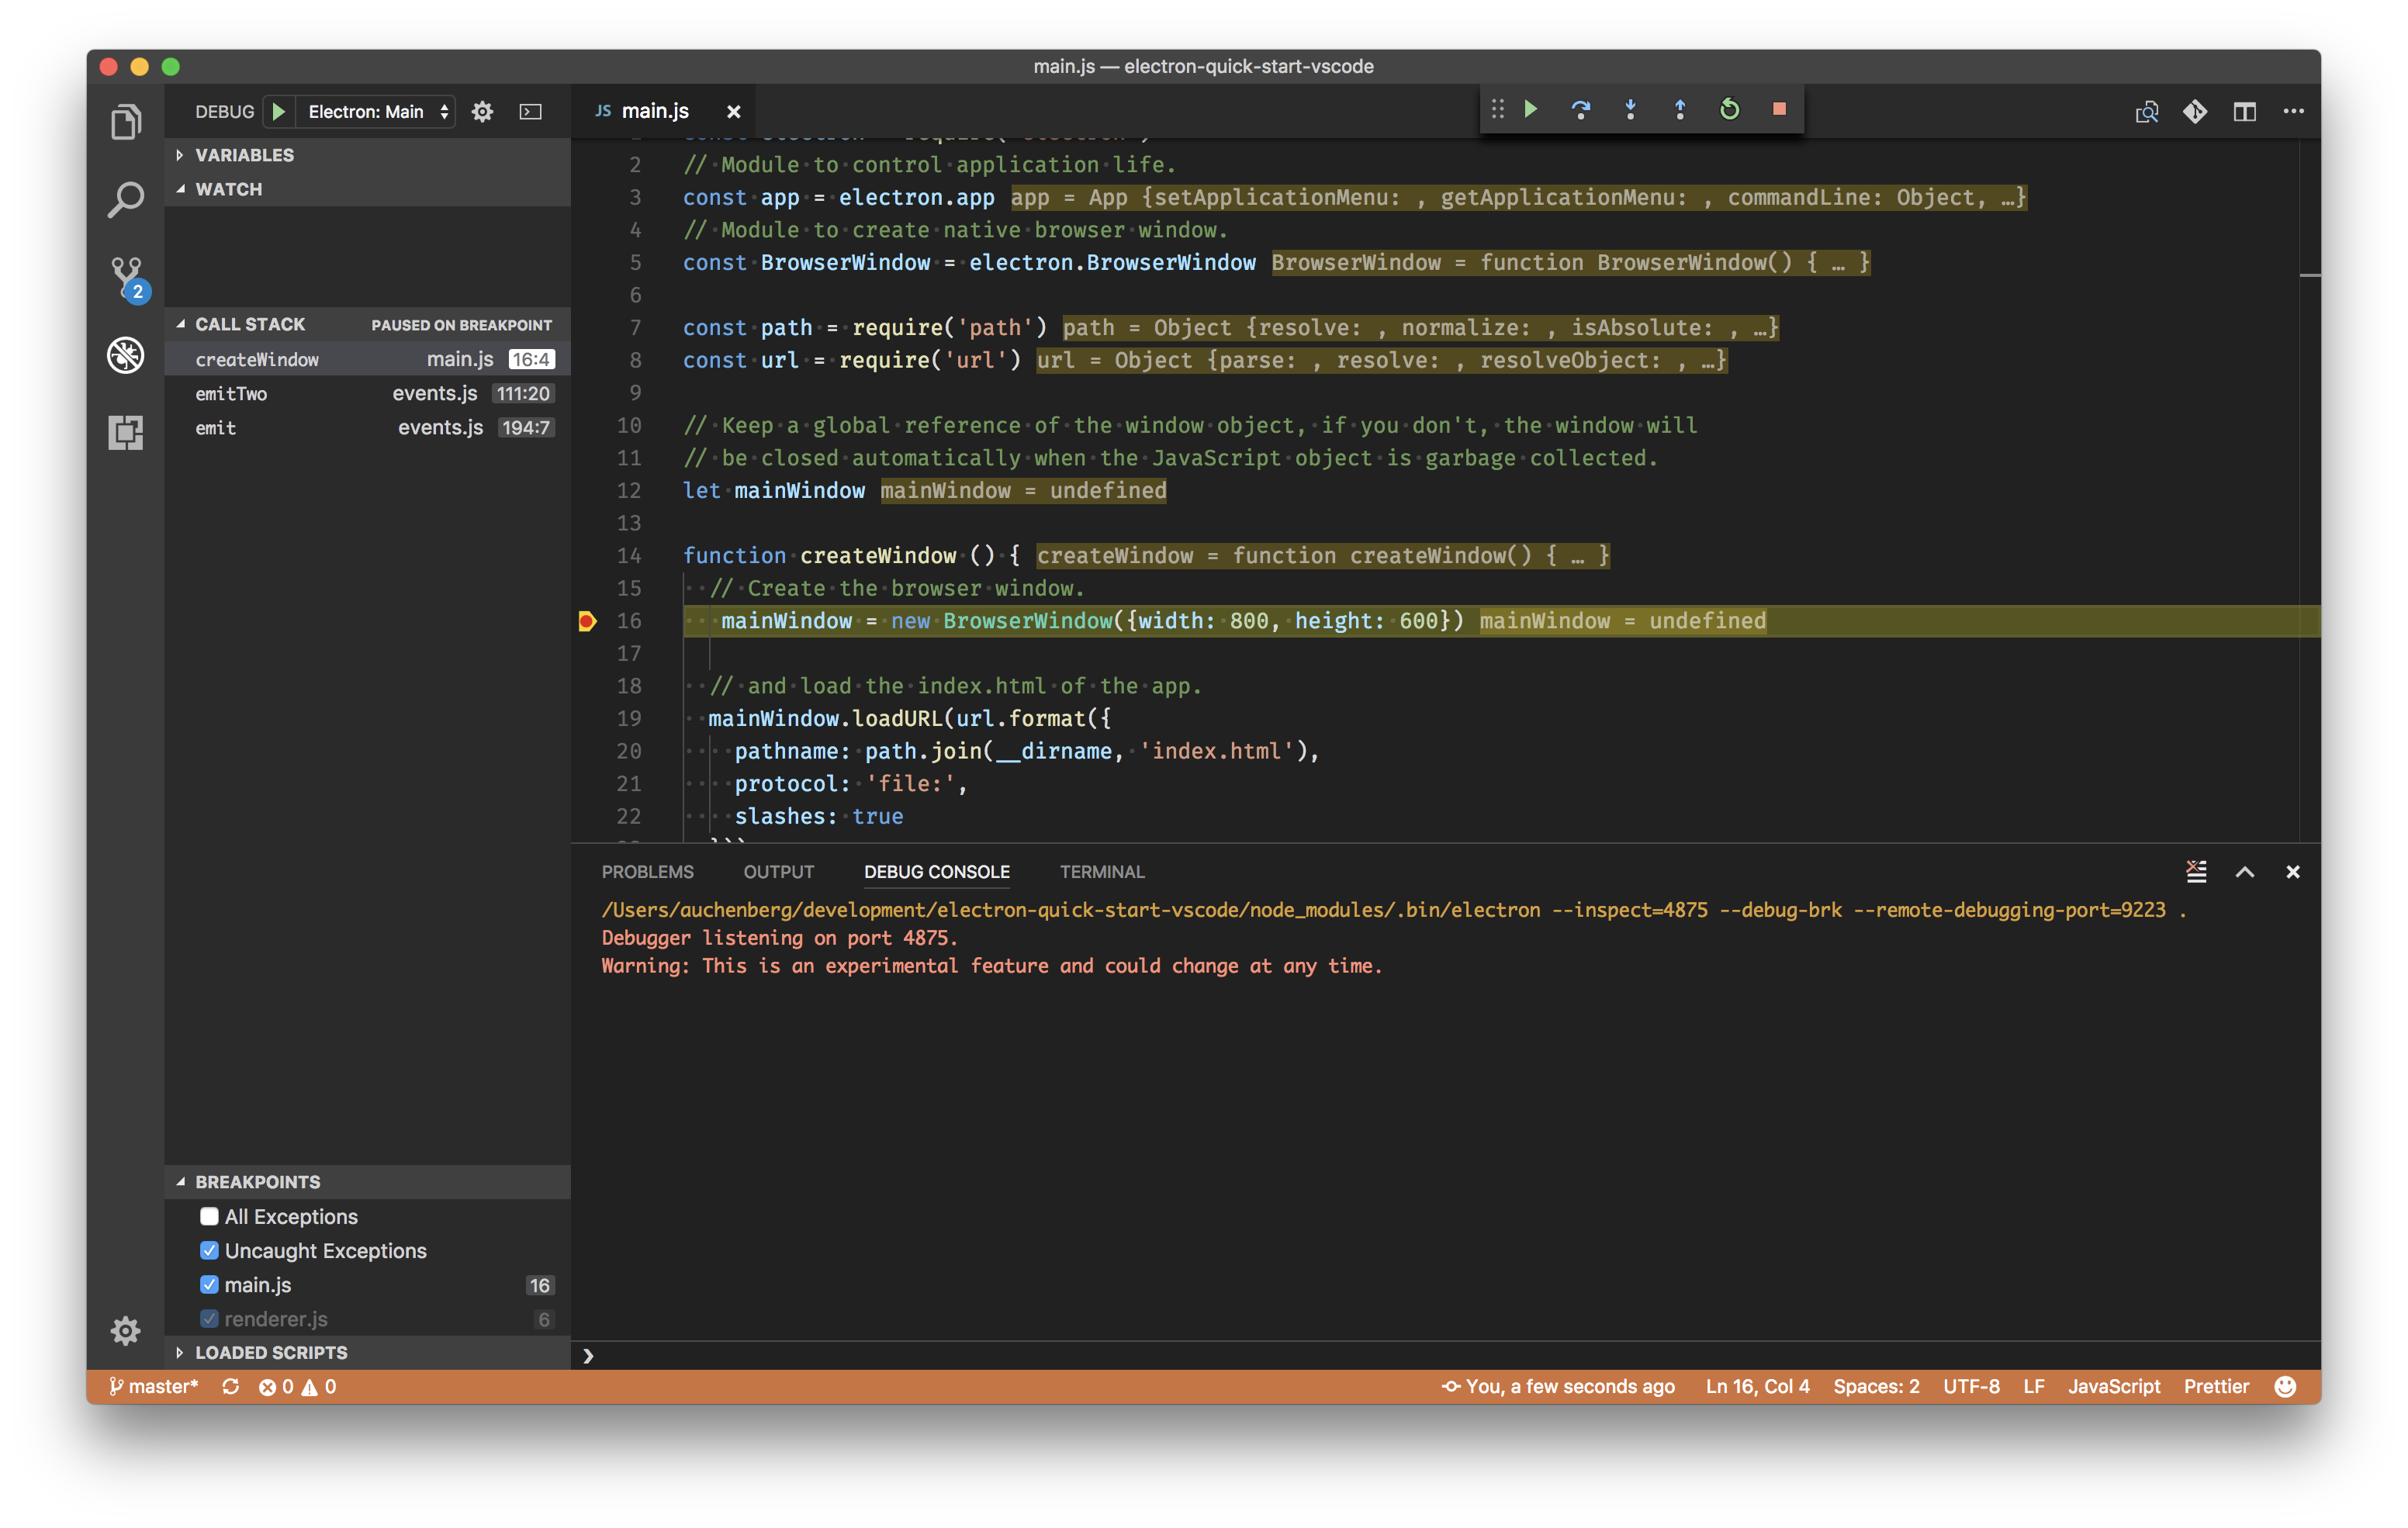
Go to the Debug view and select the 'Electron: Main' configuration, then press F5 or click the green play button.
-
VS Code should now attempt to start your Electron app, and your breakpoint on
line 16inmain.jsshould be hit.
Debugging the Renderer Process
- Update the contents of
renderer.jsto
   // This file is required by the index.html file and will
   // be executed in the renderer process for that window.
   // All of the Node.js APIs are available in this process.

   function test() {
       console.log('test')
   }

   test()
-
While your debug session is running, you can go to the Debug view and select the 'Electron: Renderer' configuration, which will connect VS Code to the Electron renderer process.
-
When connected, go to
renderer.jsand set a breakpoint online 6. -
Now go to your Electron app window and reload the page (View -> Reload or Cmd/Ctrl+R) to make sure the breakpoints are set.
-
Your breakpoint in
renderer.jsonline 6should now be hit, and you can debug the Renderer process.
Debugging Both Processes Simultaneously
Now that you have learned to debug both the Main and Renderer processes, you can take advantage of our compound configurations that enable you to start multiple debugging sessions at the same time.
- Go to the Debug view and select 'Electron: All', which will connect VS Code to both the Main and Renderer processes and enable you to have a smooth development workflow.
- Set breakpoints in any of the files like above.
- Party 🎉🔥


